10 - Documenting your Pipeline with a Data Lineage Graph
This content is also available at learn.palantir.com ↗ and is presented here for accessibility purposes.
📖 Task Introduction
Enable your team to quickly understand the flow of data in this stage of the pipeline by creating and saving a Data Lineage graph in the /documentation folder of your Datasource project.
🔨 Task Instructions
-
Ctrl+click the View Lineage button in at the top of the Pipeline outputs window in Pipeline Builder.
-
In the top left of your Data Lineage screen, click the Align icon to enable a snap-to-grid behavior.
-
Click the “gear” icon in the top right and Enable curved edges if you haven’t already.
-
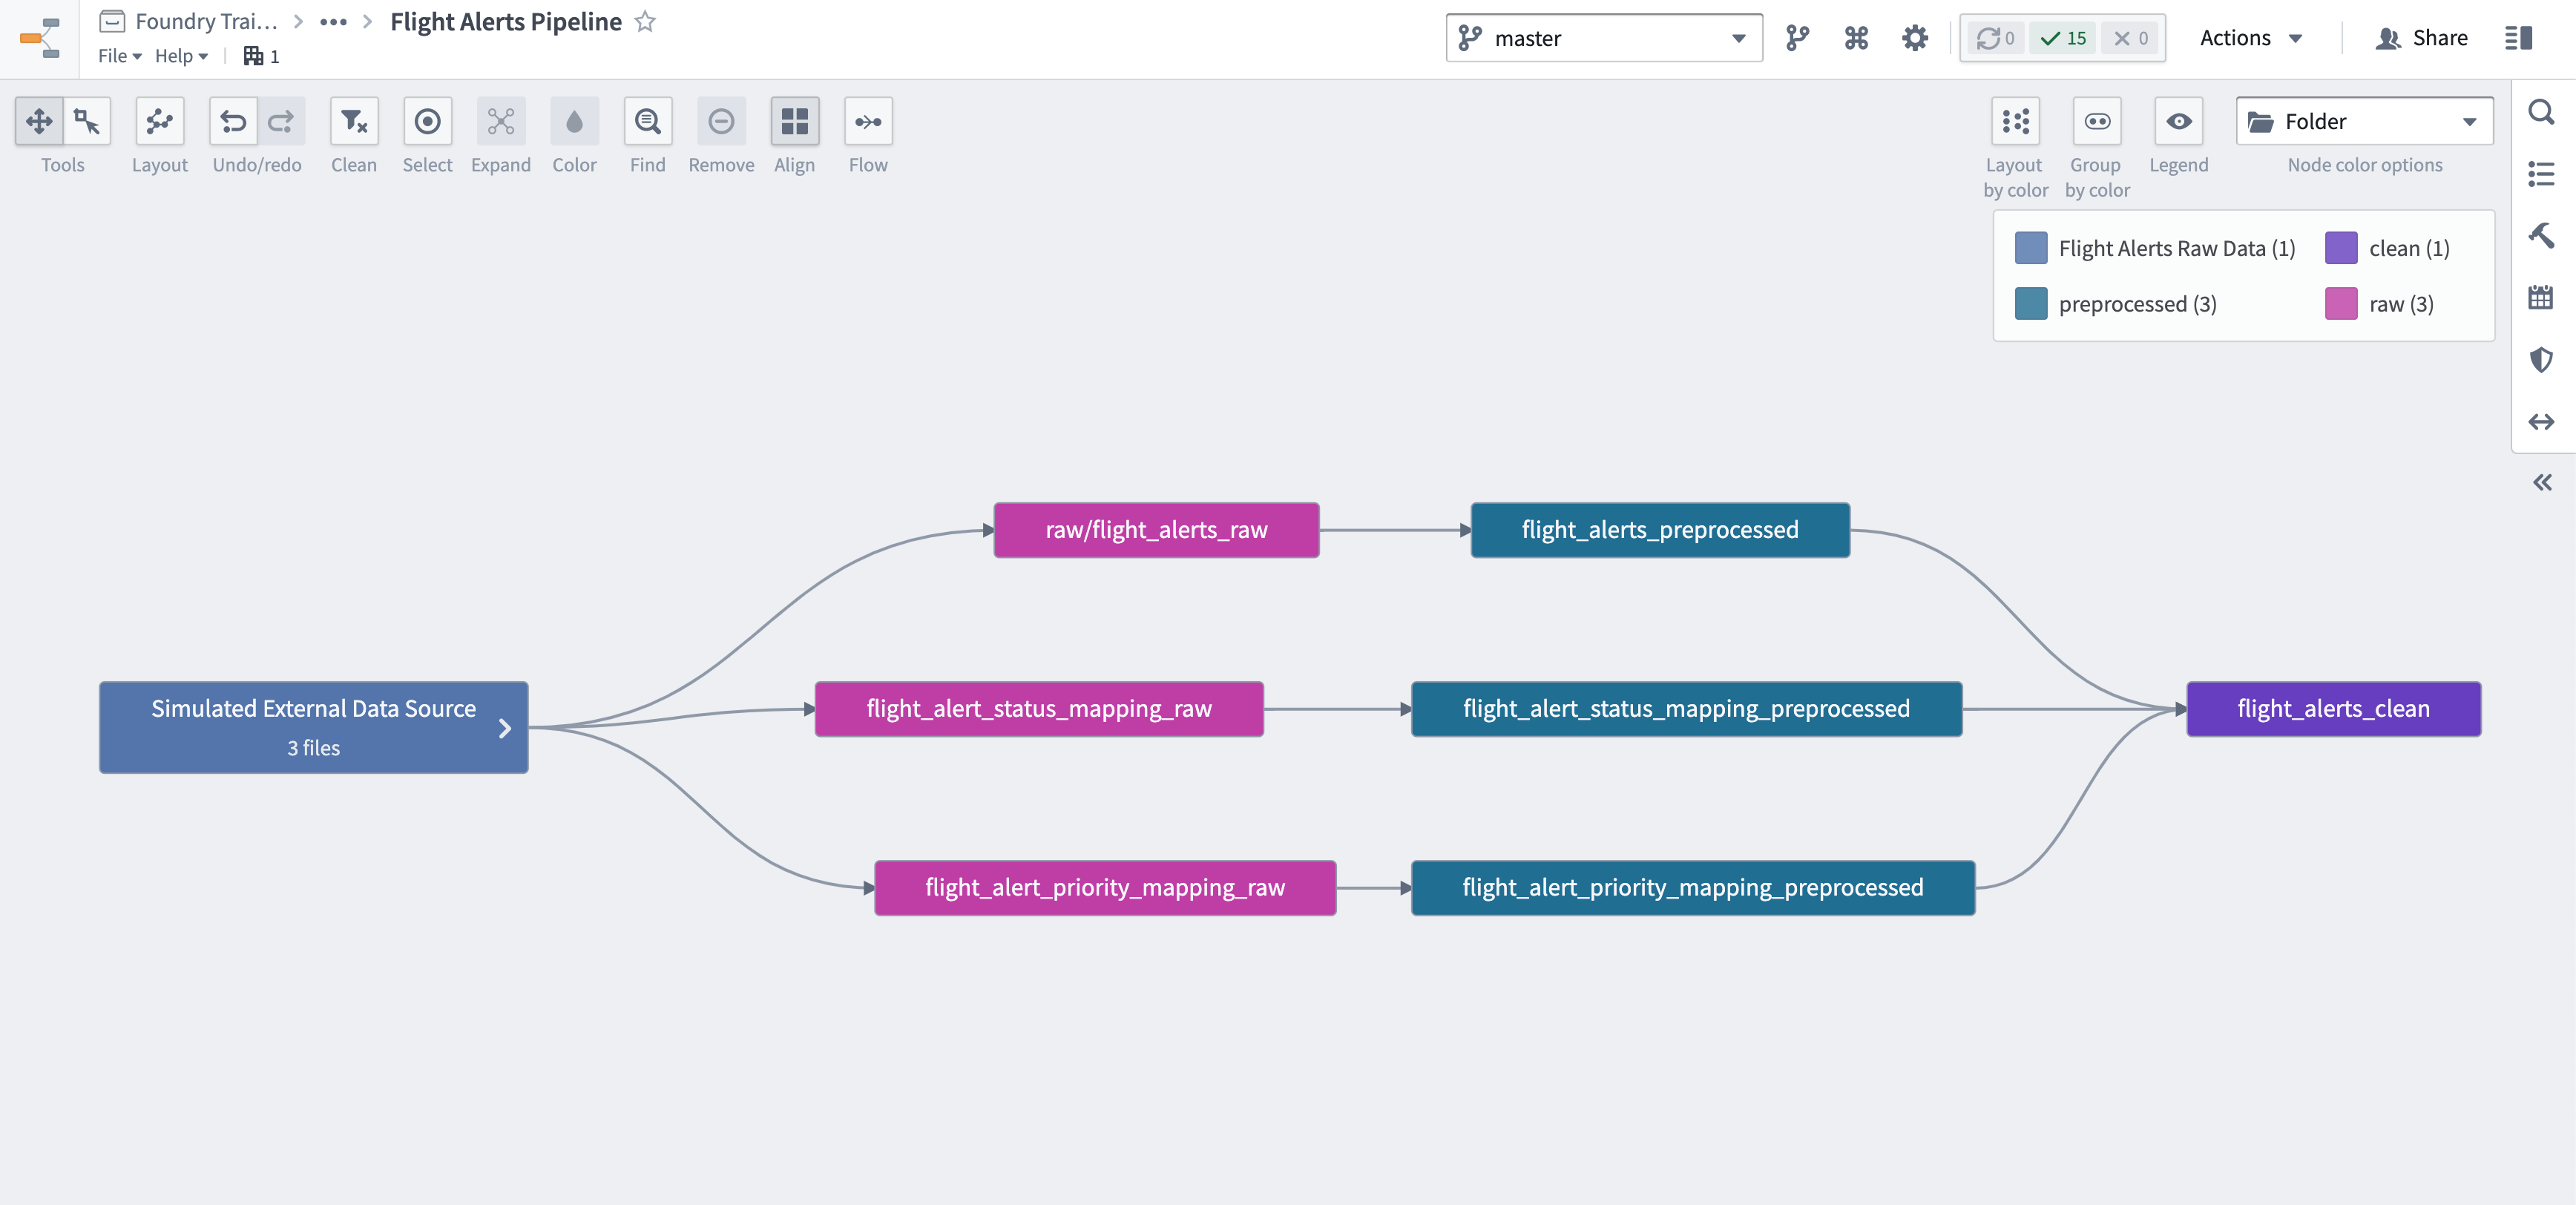
Your graph currently only shows
flight_alerts_cleanand the*_preprocesseddatasets. Highlight the preprocessed nodes and expand the lineage back to the original raw input datasets. Rearrange your nodes as needed once the lineage appears. -
Change the Node color options to Folder to more clearly identify the pipeline stages.
Remember that the “raw” datasets furthest upstream are merely simulating external datasources. If your raw dataset connections came from, say, a single external Postgres database called
sample-source, your graph would look something like this: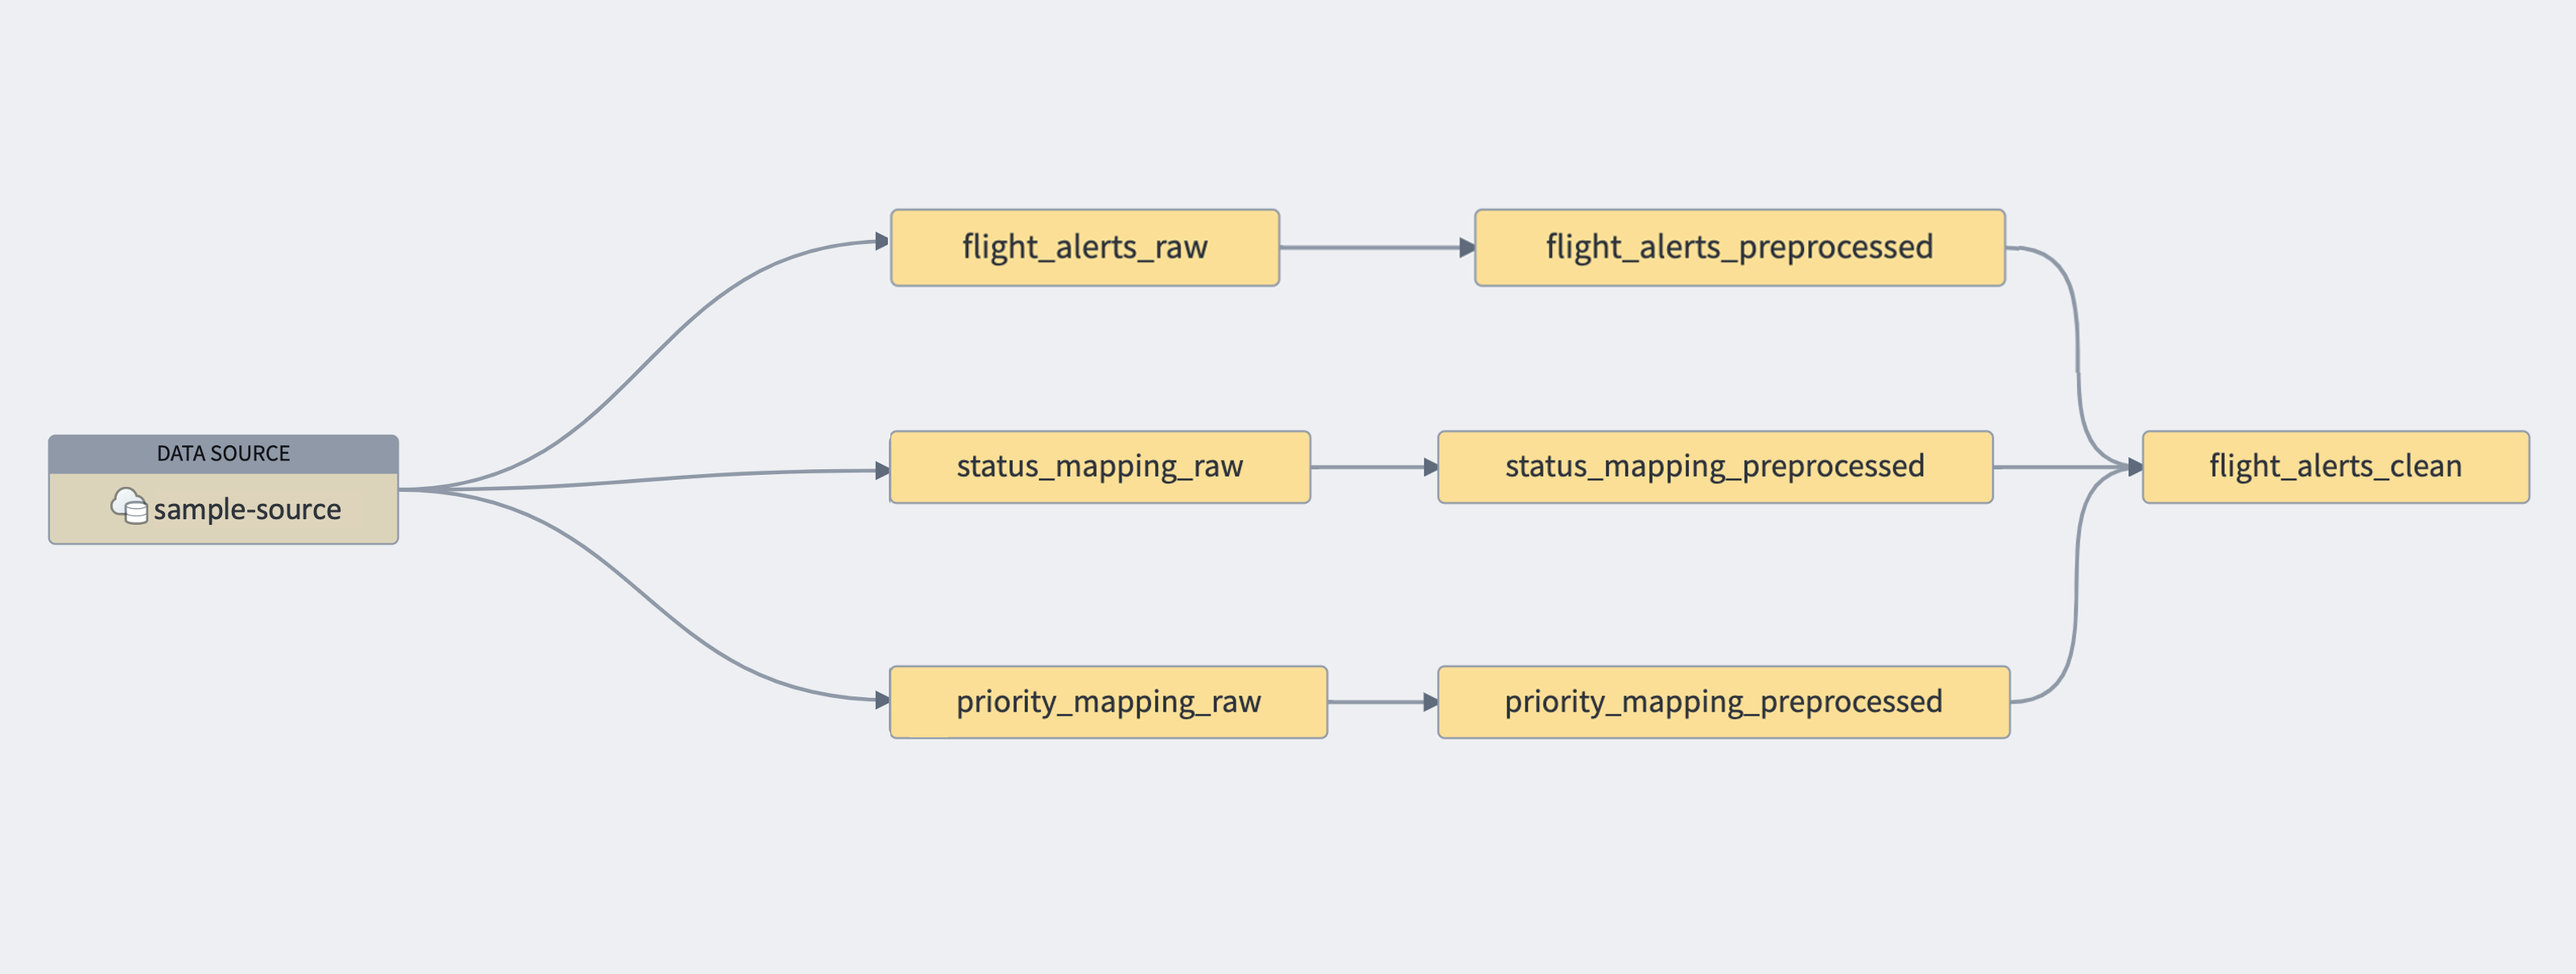
-
Let's simulate this configuration as close as possible. Click shift and drag a selection box around the left-most, "Flight Alerts Raw Data" nodes on your graph.
-
Right click on the selection and choose Group nodes...
-
Name your group "Simulated External Data Source."
-
Click the blue Save button in the top right area of the Data Lineage application. Save the file as Flight Alerts Pipeline in the
/documentationfolder of your Datasource project (i.e.,.../Data Engineering Tutorials/Datasource Project: Flight Alerts/).