3 - Sample Data Pipeline
This content is also available at learn.palantir.com ↗ and is presented here for accessibility purposes.
📖 Task Introduction
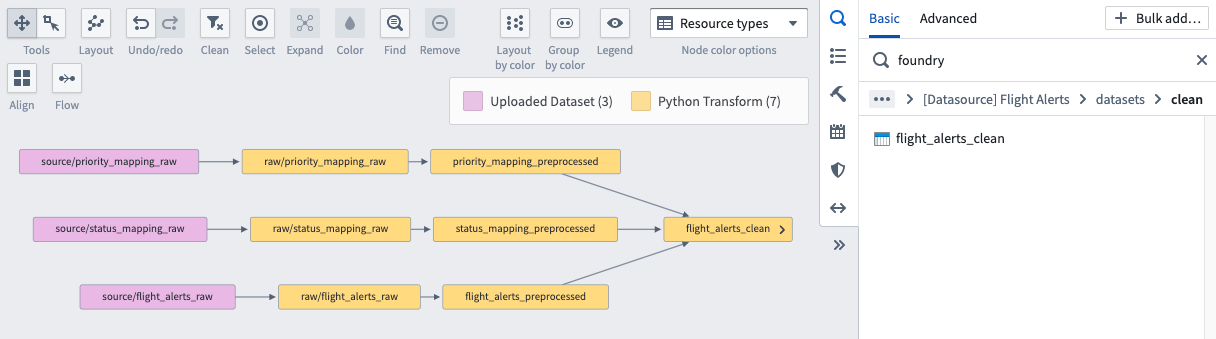
Let’s start by looking at a pipeline in your Foundry environment that builds the flight_alerts_clean dataset. In this notional case, your colleagues generated this pipeline to integrate multiple datasources and make a clean dataset available to end users and even create Ontology objects later on to power interactive, user-facing applications. Building this pipeline required adopting a data-driven mindset and decomposing the problem to be solved into its sequential, constituent elements.
🔨 Task Instructions
-
Open the Data Lineage application.
-
Click the “Search Foundry” magnifying glass in the in the top right area of the screen.
-
Choose the All projects filter option in the list below.
-
Conduct a search for the Foundry Training and Resources project and click the result once it returns. Then navigate through the project folder structure to the following dataset and add it to the graph:
/Example Projects/[Datasource] Flight Alerts/datasets/clean/flight_alerts_clean -
On your graph, click the < on the left side of the flight_alerts_clean node to expand the parent datasets that feed into the flight_alerts_clean dataset.
The series of dataset inputs and outputs that culminate in the generation of this dataset represents the dataset’s lineage. What makes a lineage graph a pipeline is that it builds as a cohesive unit in accordance with scheduling logic. A pipeline may be composed of many lineage paths, and a lineage path may not represent the entire pipeline.
Because the data for this training is notional, the pipeline backing the flight_alerts_clean dataset is quite short. If you would like to see what a larger pipeline looks like, head over to the documentation.
-
Click the “Manage schedules” button (the calendar icon) in the right-hand panel, which will reveal any build schedules used by the nodes on the graph.
-
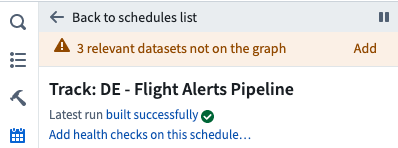
Click the Training: DE - Flight Alerts Pipeline appears in the list. You’ll explore pipeline schedules in detail in a separate tutorial. For now, explore the schedule to understand which datasets are Triggers and Targets. Refer to the documentation if you want to learn more about managing schedules from the Data Lineage graph.
-
If you have not fully expanded the lineage of the flight_alerts_clean dataset, you might be prompted to ⚠️ add relevant datasets that are not on the graph. Though each dataset on the graph has its own lineage, all datasets on the graph belong to a single pipeline that builds together using the logic defined in the schedule.
-
Click the blue Exit schedule button near the top of the screen.
-
The Data lineage graph node color options enable us to quickly ask questions about the state of this pipeline. Take a moment and alternate between the following color options:
- Build status
- Build duration
- Spark usage (in the last 3 months)
- Time last built
-
Click the Flow button near the top center of the screen to simulate the movement and transformation of data from one end to the other.
-
As you’ll see later in the track, it’s a best practice to save a snapshot of your pipeline in Data Lineage at the root of your project. If you've already created a personal sandbox folder for use during tutorials, save your Data Lineage graph into that folder. If you have not, follow the steps from the Create a Sandbox Folder page from the Introduction to Palantir Foundry tutorial to create it now, then save your Data Lineage graph to it.