18 - Layouts: Filtering with Charts
This content is also available at learn.palantir.com ↗ and is presented here for accessibility purposes.
The simple, representative charts you’ve just created enhance your exploration with visual indicators of key object type properties. These charts can also be used to further filter your exploration. Suppose you saw your acquisition date chart and wanted to narrow in on those aircraft purchased before 2010.
🔨 Task Instructions
-
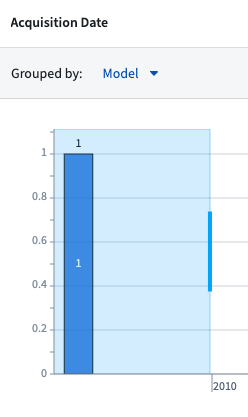
In your Acquisition Date chart, click and drag from the leftmost data bar until ~2010 as shown in the image below.
-
Click the blue Apply filter for 1 selected range button. Notice that two things happen.
- A new filter parameter is added to your search bar reflecting your chart selection.
- All of the charts in the main canvas area update according to that new filter.