22 - Publish and view your new dashboard
This content is also available at learn.palantir.com ↗ and is presented here for accessibility purposes.
📖 Task Introduction
Now that you have created a dashboard, let's publish it and view the new artifact that is created as a result of publishing.
🔨 Task Instructions
-
Publish your dashboard by selecting the Publish option in the top right corner and saving it in your
/Tutorial Practice Artifacts/folder or a designated save location. -
In Foundry, navigate to the location where you just saved your dashboard.
-
Open your published dashboard titled
Flight Alert Context Dashboardand note this is a separate artifact from the Quiver analysis you built to create the dashboard. -
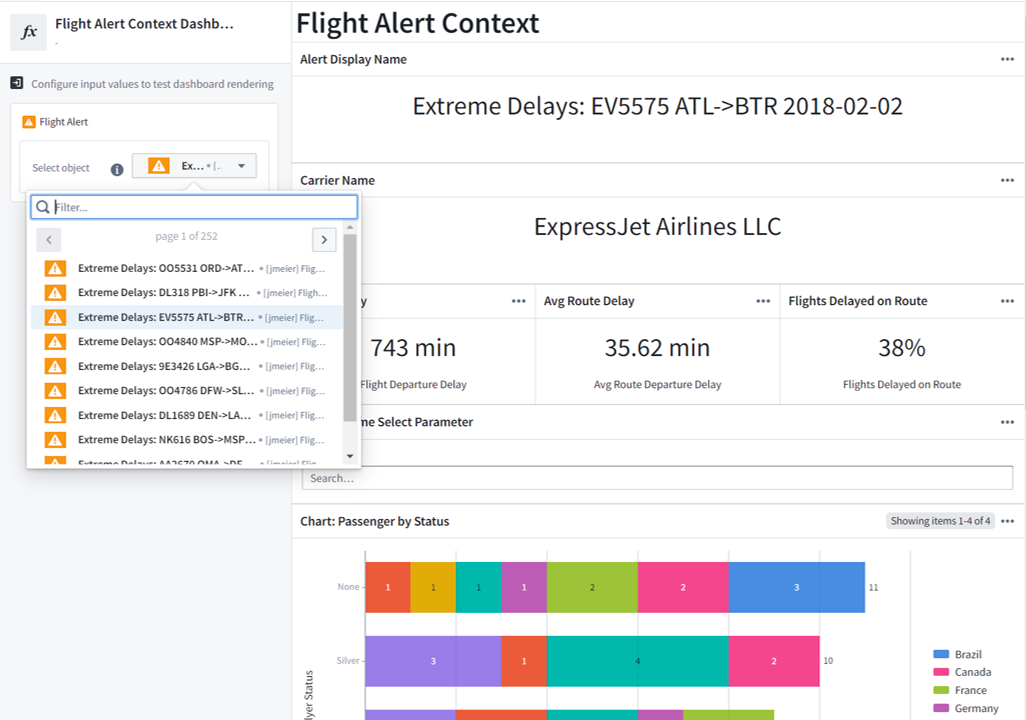
Select Show inputs at the top of your screen, which will open a sidebar on the left side of your screen.
-
Change the input Flight Alert object by using the dropdown menu and selecting any other alert.
- All the cards on the dashboard update using information from the selected input, confirming that the templating mechanism will work properly when embedding this dashboard elsewhere in Foundry.
-
Test out the Carrier Name Select Parameter by choosing a carrier name and then observing the update in the Chart: Flight Performance