19 - Exercise Summary
This content is also available at learn.palantir.com ↗ and is presented here for accessibility purposes.
Solution
What you built
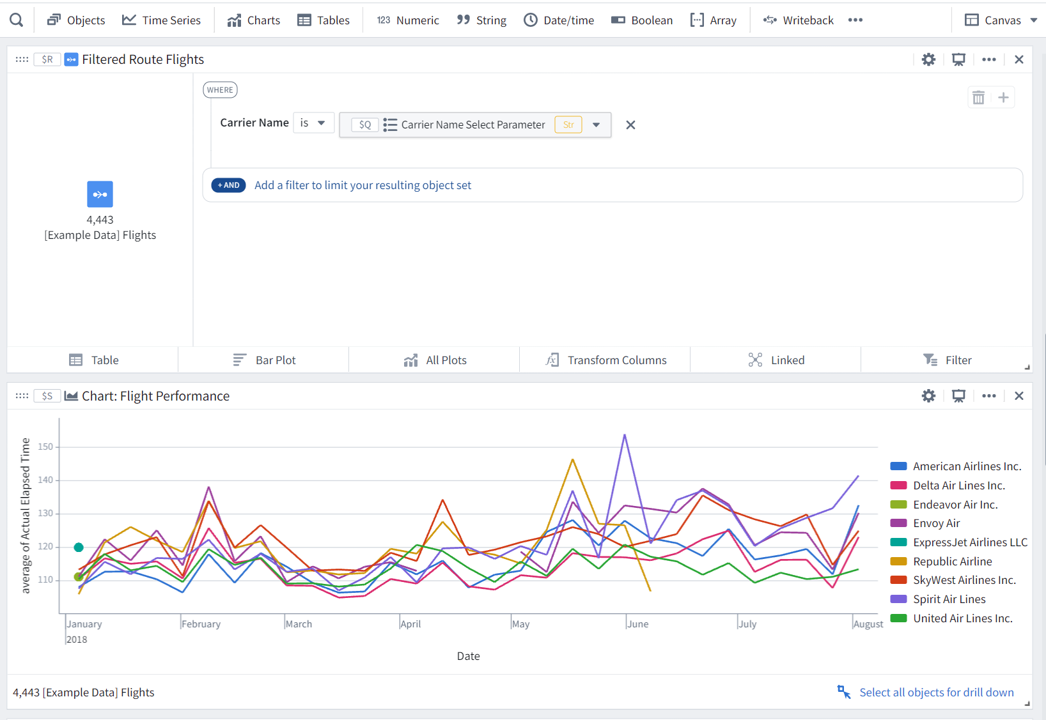
- A bar chart of passengers associated with your starting flight alert.
- A property-based parameter used to filter route flights.
- A line chart of flight performance on this route segmented by carrier.
What you learned
- Parameters act as variables that let a user input values manually to dynamically change the data in the analysis.
- Chart-based visualizations provide more context to the applications you build.