14 - Exercise Summary
This content is also available at learn.palantir.com ↗ and is presented here for accessibility purposes.
Solution
What you built
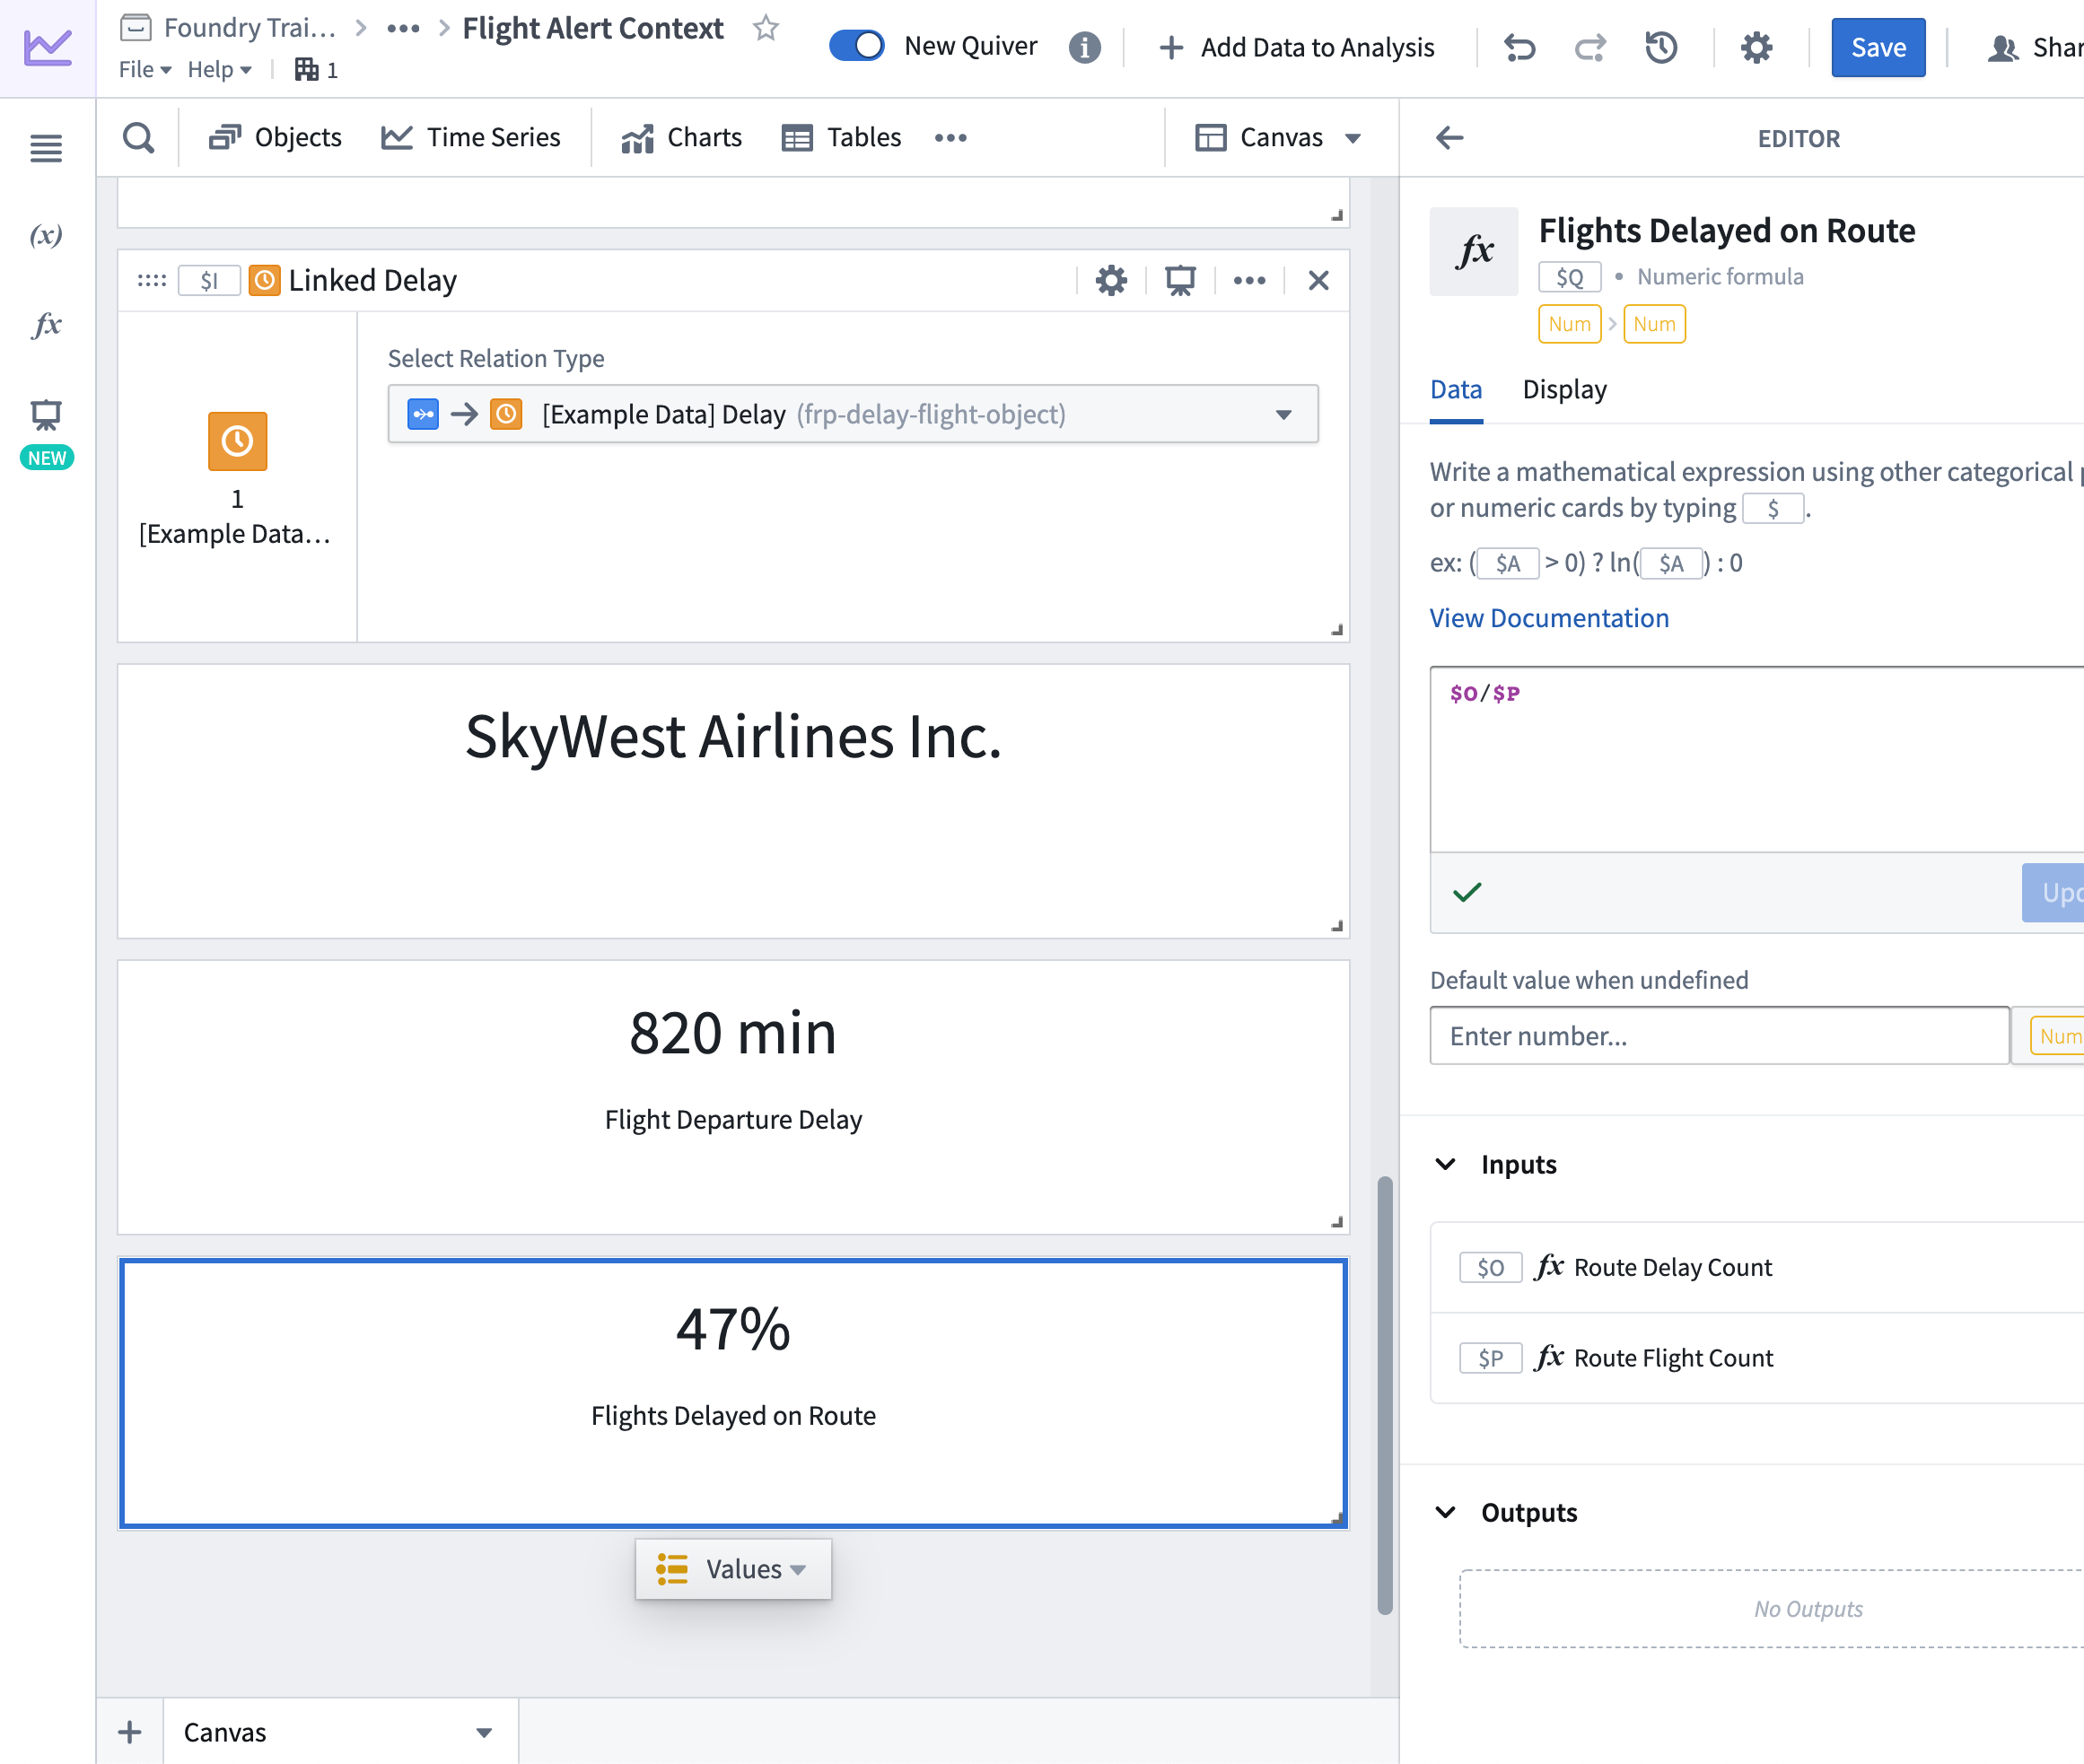
- Two numeric aggregation cards: one for the count of Route Flights and the other for the count of Route Delays.
- A numeric calculation card that uses the Plot References of the numeric aggregation cards to derive the percent of flights delayed on the route (i.e., the route where your original flight alert occurred).
What you learned
- You can mathematically derive metrics from other numeric values by referencing their Plot References in a Numeric Formula card.
📚 Recommended Reading (~4 min read)
Take a moment to read more about using numeric formulas in Quiver here.