7 - Adding a numeric property card
This content is also available at learn.palantir.com ↗ and is presented here for accessibility purposes.
📖 Task Introduction
Another set of figures you’d like represented in your canvas is the departure delay on this flight alert and the average departure delay for flights on this route. This path introduces some additional complexity, but we’ll explore some of Quiver’s features for easily following the logical flow of your analysis.
As you proceed, you’ll want to bear in mind the underlying links between the applicable Ontology object types:
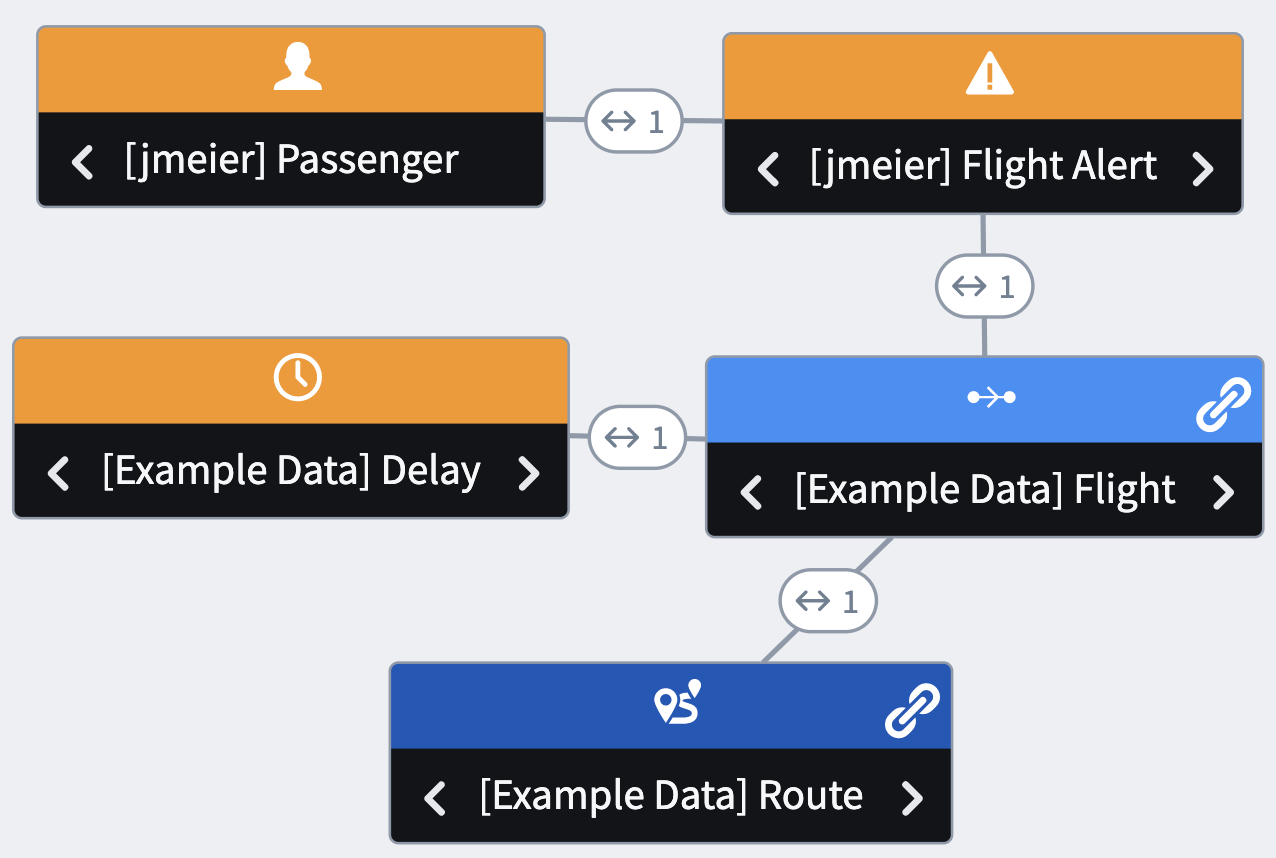
🔨 Task Instructions
-
Departure delay is a property on the
[Example Data] Delayobject type. Click into your Linked Flight card and choose Linked object set from the Objects category button. -
In the configuration panel, choose
[Example Data] Delayfrom the Select Relation Type field. -
Rename the new card from the generic (e.g.,
[Example Data] Delays linked to [Example Data] Flights) toLinked Delay. -
Click the Numeric button in the application bar near the top of your screen.
-
Choose Object Property.
-
In the card configuration window on the right, choose Linked Delay as the Input Object and
Dep Delayas the Property. -
Click into the name of the card at the very top of the editor (e.g.,
Arr: 830.0 Dep: 820.0 Dep Delayand rename it toFlight Delay. -
In the editor’s display tab, make the following adjustments:
- Manual Description Override: Flight Departure Delay
- Inline Header: “On”
- Metric Alignment: Align Center
- Description Alignment: Align Center.
-
Click the “gear” icon to the right of the Format field header and choose Visual format. This will bring up the formatting editor you’ve encountered in OMA and while configuring Object Views.
-
Change the Standard to Standard Unit and in the sub-field that appears, choose Minute.
-
Save your analysis.