10 - Create a Time Series Formula Chart, Part 2
This content is also available at learn.palantir.com ↗ and is presented here for accessibility purposes.
📖 Task Introduction
Complete the steps below to create your Time Series Formula card.
🔨 Task Instructions
- Click into the text area box in the configuration panel of your Time series formula card.
- In text area, replace the default value of
0with$. This will open a menu of available global identifiers in your analysis. - Select your [Altitude] Time Series. This will fill in a default one-letter variable name, such as
$L, though your letter may be different. - Type a
/to the right of your variable (e.g.,$L/). - Type another
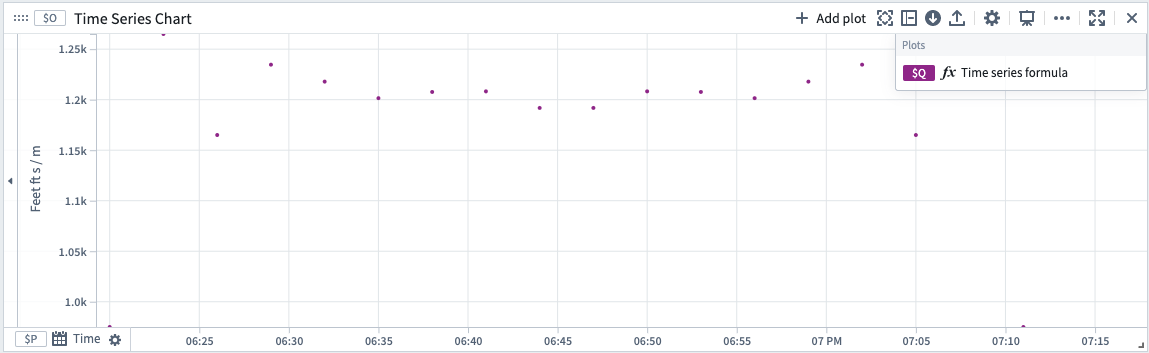
$but, this time, select your [Wind Speed] Time Series from the menu (e.g.,$L/$F). - Click the blue Update button to apply a time series formula that calculates the ratio between Altitude and Wind Speed. This creates a new Time Series chart.
- In the configuration panel, click the Display tab.
- Select the Points display.
- Close the right-hand configuration panel so you have more room to work.