8 - Creating a Scatter Plot on Time Series Data
This content is also available at learn.palantir.com ↗ and is presented here for accessibility purposes.
📖 Task Introduction
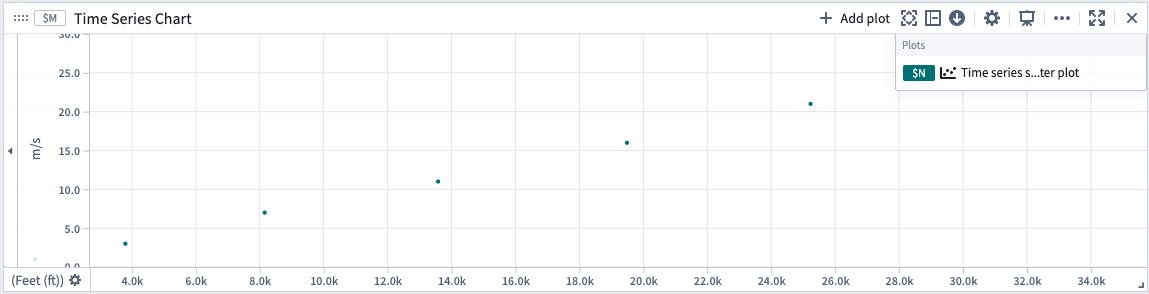
Quiver's Time Series Scatter Plot chart allows you to create a scatter plot of two Time Series against each other. In this task, now that we have two Time Series created, we can create a scatter plot of the two Time Series against each other.
🔨 Task Instructions
- From the omnibar near the top of your Quiver analysis, click the Charts button.
- In the dropdown menu, select the Time Series Scatter Plot option.
- In the configuration panel on the right, set the
[Altitude] Time SeriesTime Series as the x plot and the**[Wind Speed] Time Series**as the y plot. - Set the Time range to
Default Shared Time Axis - Close the configuration panel.