4 - Preparing an Object Set to Create a Time Series, Part 2
This content is also available at learn.palantir.com ↗ and is presented here for accessibility purposes.
📖 Task Introduction
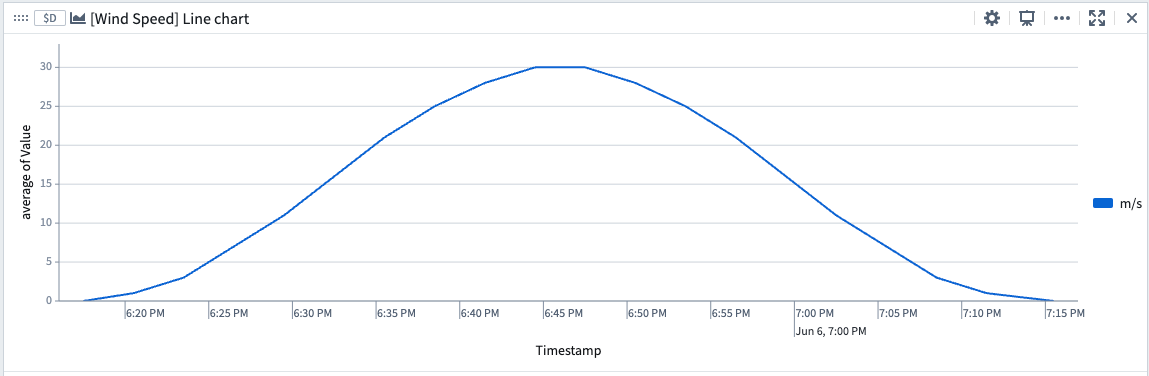
In this task, you'll create a Line Chart on the [Wind Speed] Flight Sensor Readings Object Set you just created in the last task.
🔨 Task Instructions
-
At the bottom of the Filter Object Set widget, choose Line chart from the Chart category button menu
-
In the chart's configuration panel on the right, group by the Timestamp property.
-
In the Bucketing selector, choose Minute.
-
Scroll down to the Series section and set-up the following:
- Metric selector: choose Average
- Property selector: choose Value
- Missing/ null values display selector: choose Ignored
-
Switch to Display tab, and in Items replace
average of Valuewithm/s -
Rename your board
[Wind Speed] Line chart