16 - Overlay Charts
This content is also available at learn.palantir.com ↗ and is presented here for accessibility purposes.
📖 Task Introduction
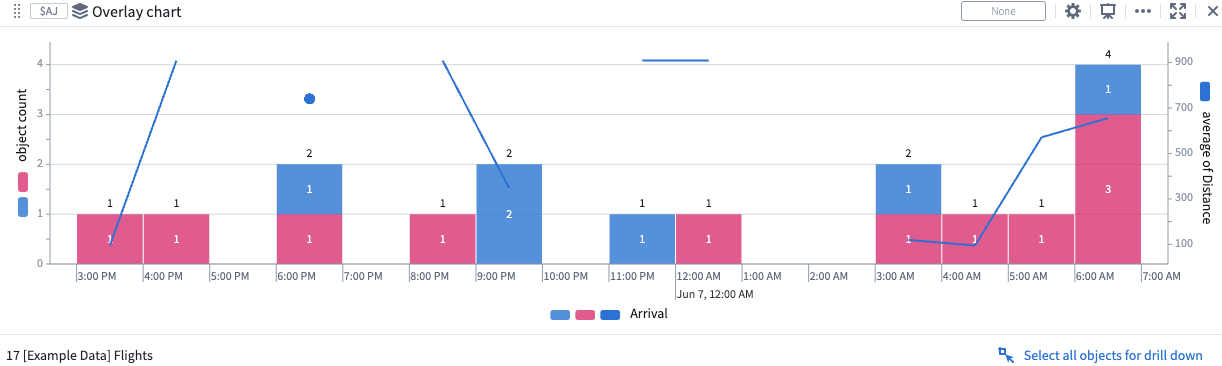
Quiver allows you to create new charts by overlaying two or more other charts from your Quiver Analysis. In this Task, you'll do this with your Categorical Line Plot created in the prior Task and the Arriving Flights by Runway chart.
🔨 Task Instructions
- Click on the
Search cardsbutton on the omnibar near the top of your Quiver analysis. - Within this subwindow, search for and select
Overlay Chartfrom the results. - In the Editor sidebar, click on
Add plotand select your Arriving Flights by Runway: JNU object set. - Click on
Add plotagain and select your Average Distance of Arriving Flights line chart created in the prior task. - Close your configuration panel on the right.