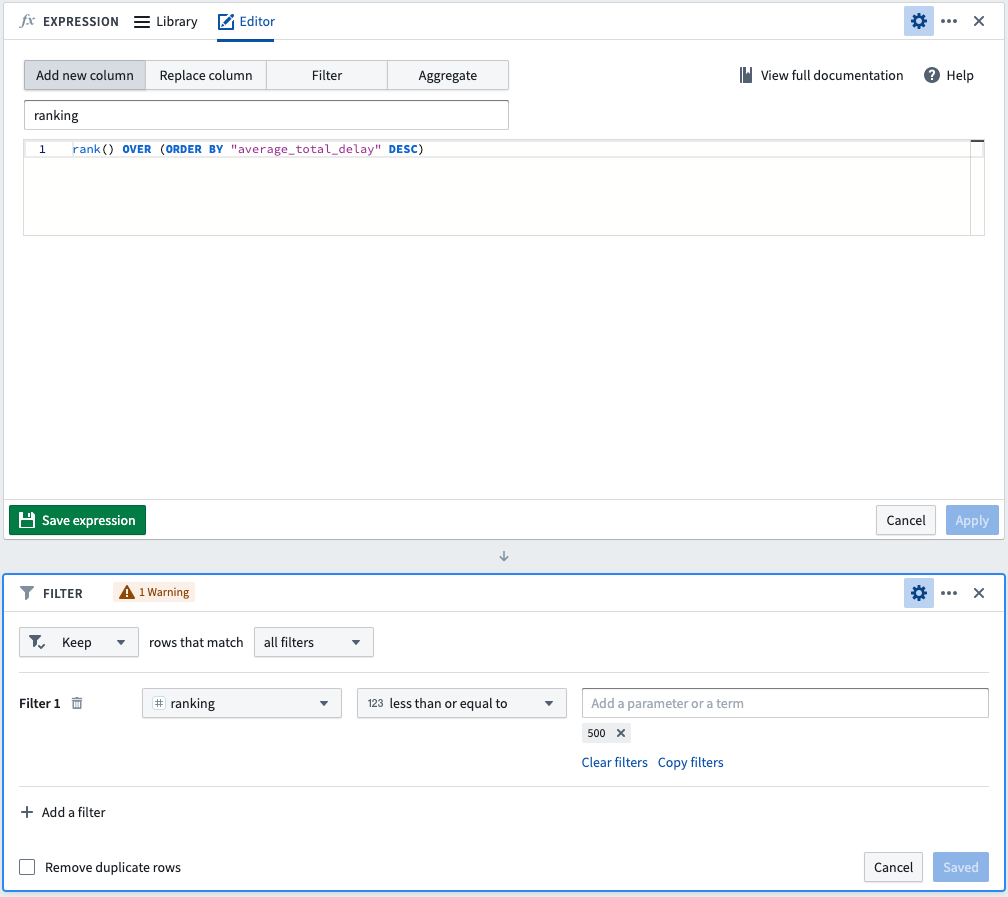
13 - Filter to Top 500 Delays
This content is also available at learn.palantir.com ↗ and is presented here for accessibility purposes.
📖 Task Introduction
With our Pivot Table and Expression boards, we created a new column to get the average delay of each of the routes. This information will be immediately impactful for our notional aviation team. However, there are over 4,000+ rows of data. So let's narrow our investigation to the top 500 routes with the most significant delays.
🔨 Task Instructions
-
Click on the Transform board category in the bar at the bottom of your Contour path and select the
Expressionboard. -
Within the
Expressionboard, proceed to write a new expression. -
Leaving the default selection of Add new column selected, type in
rankingas the name of your new column. Then, in the expression editor (i.e. next to the “1”), add the expression code provided below, then click Apply.rank() OVER (ORDER BY "average_total_delay" DESC) -
Now click on the Filter board category in the bar at the bottom of your Contour path and choose a
Filterboard. -
Click on the Select columns... field and search for
ranking. -
Click on the middle dropdown where it says
equal toand change it toless than or equal to. -
Finally, click on the rightmost field in this row where it says to Add a parameter or a term and enter the value
500. Click Save.ℹ️ The
⚠️Warningadvisory message on the Filter board you create in this task is expected. This occurs because therankingcolumn you create in the Expression board is non-deterministic; because there are "ties" in the column used in theORDER BYclause, the exact numeric rank given to each row in the active dataset could change each time this board is computed. If this were undesirable, this could be achieved by creating and ranking on a different column whose values are unique across all rows. In the case of this tutorial, this non-determinism will not affect our work.
📚 Recommended Reading
For more information on non-determinism in Contour, see this page in the Documentation.