12 - Analyze the Most Delayed Route
This content is also available at learn.palantir.com ↗ and is presented here for accessibility purposes.
📖 Task Introduction
As we now have a dataset that is derived directly from the pivot table, we can perform further analysis to shine more lights on the flight delay information. Since we have the arrival and departure delay, we need an expression for the average overall delay.
🔨 Task Instructions
-
Select the Transform board category in the bar at the bottom of your Contour path and select the
Expressionboard. -
Within the
Expressionboard, depending on your configuration of Foundry, you may see a Write new expression option in your newExpressionboard. If you do, select that option. Otherwise, select the Editor tab located to the right of Library. -
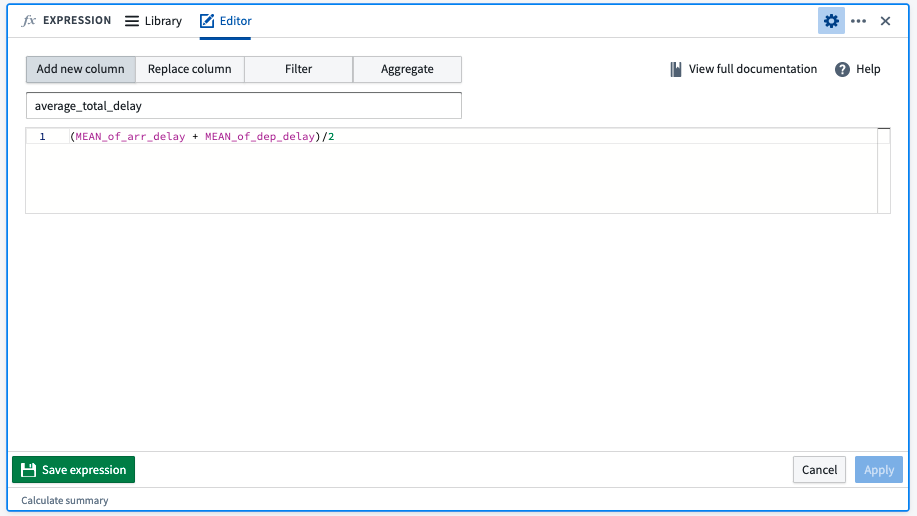
Leaving the default selection of
Add new columnselected, enteraverage_total_delayas the name of your new column. Then, in the expression editor (i.e. next to the “1”), add the expression code provided below and choose Apply.(MEAN_of_arr_delay + MEAN_of_dep_delay)/2