21 - Add a Vertical Bar Chart
This content is also available at learn.palantir.com ↗ and is presented here for accessibility purposes.
📖 Task Introduction
Now that you're familiar with Chart Board basics, let's explore a second type of chart: the Vertical Bar Chart.
With this chart, we'll plot the average flight speed and explore any correlation with flight duration. Our hypothesis will be that the longer the flight duration, the greater its average speed, potentially due to the fact that planes tend to travel more slowly upon departure and arrival.
🔨 Task Instructions
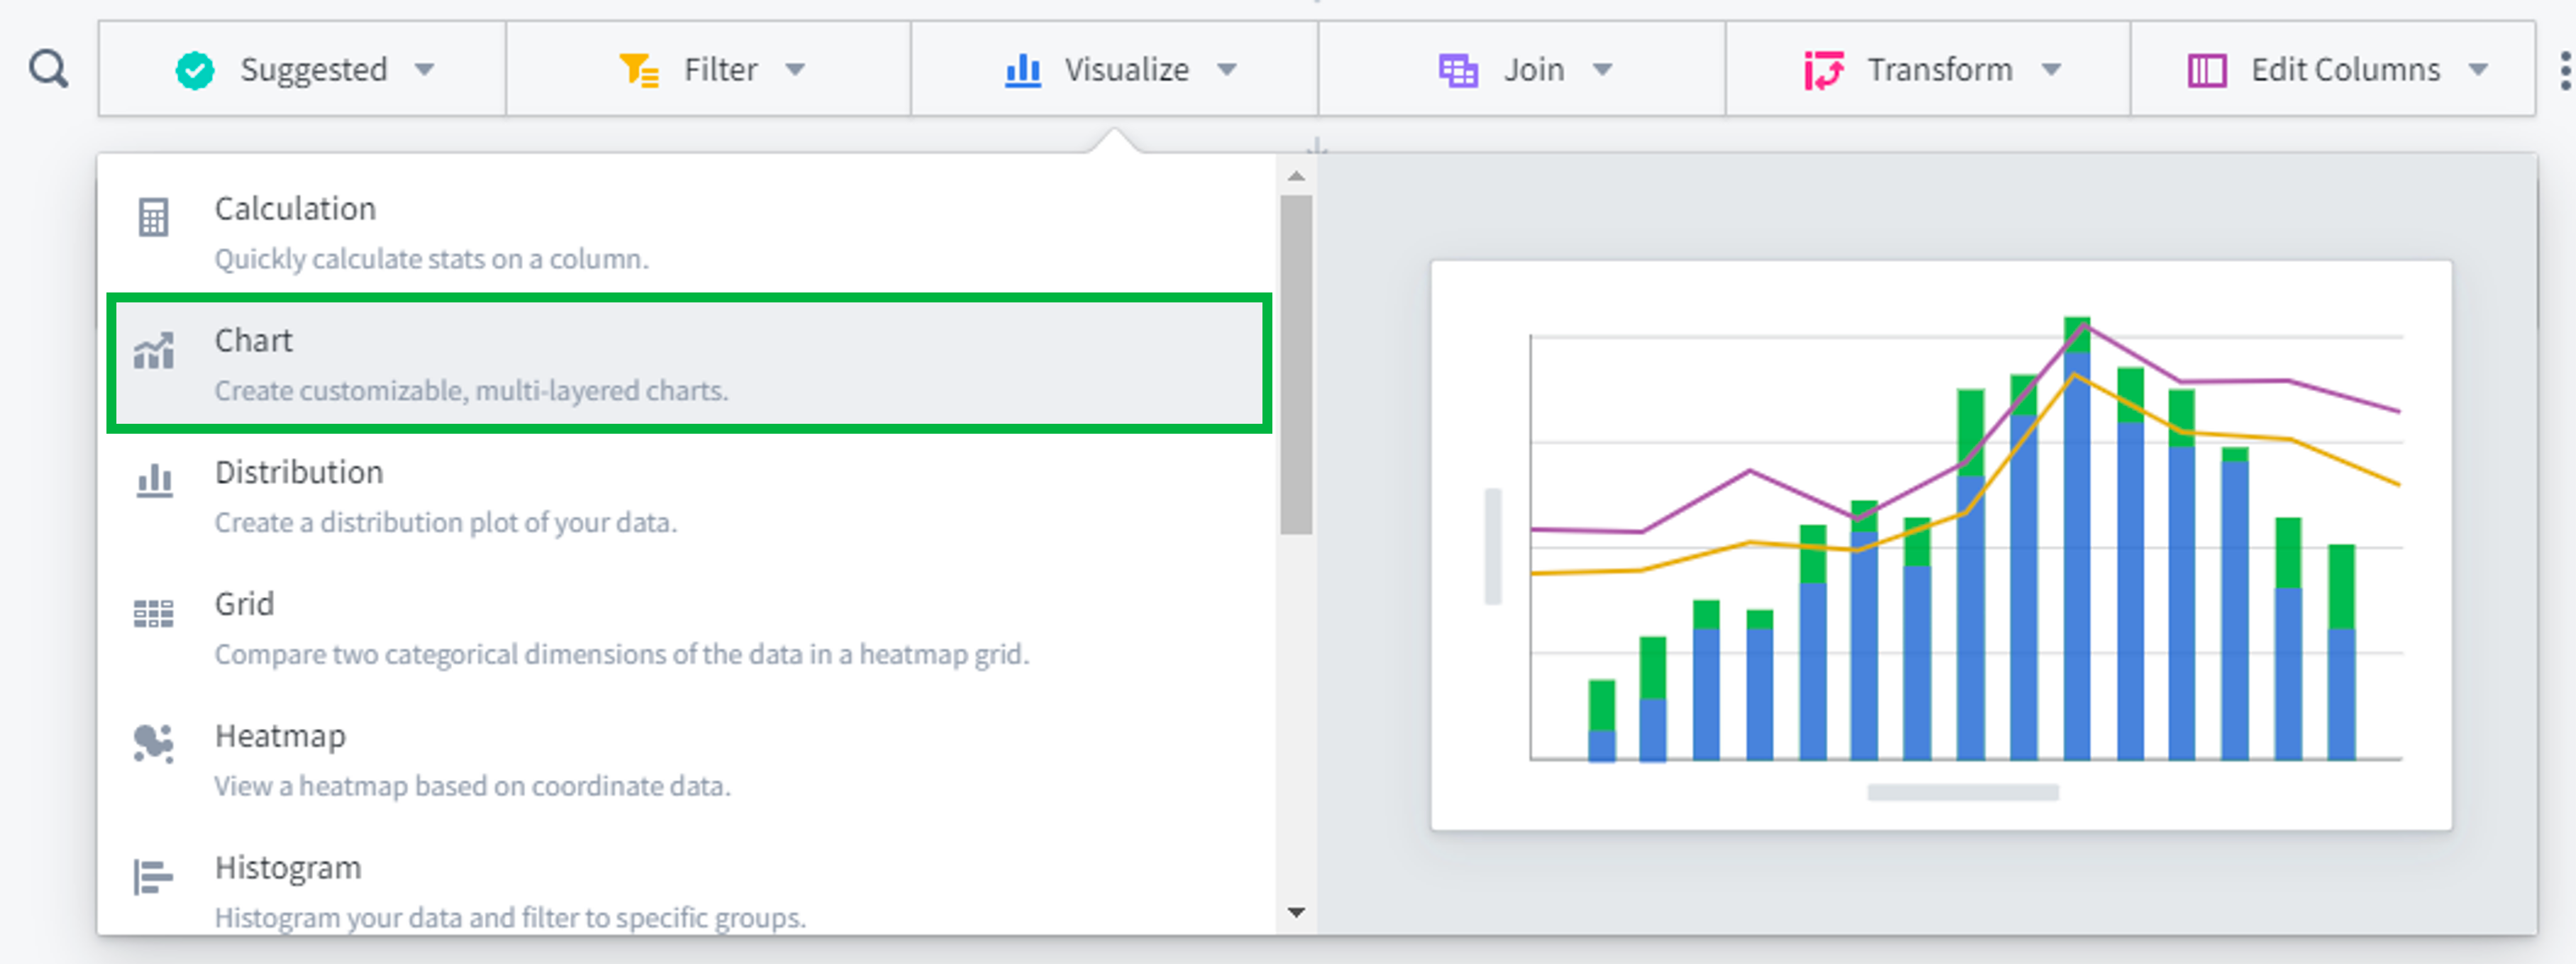
In the Board Toolbar, click on the Visualize category, then select the Chart Board.