8 - Use the Histogram Board
This content is also available at learn.palantir.com ↗ and is presented here for accessibility purposes.
📖 Task Introduction
Let's add a Histogram Board beneath our Table Board. The Histogram Board enables visualization and filtering on any single column of your active dataset in a simple horizontal bar chart.
The Board Toolbar should now be displayed beneath the Table Board (rather than at the top of the analysis where it was previously).
🔨 Task Instructions
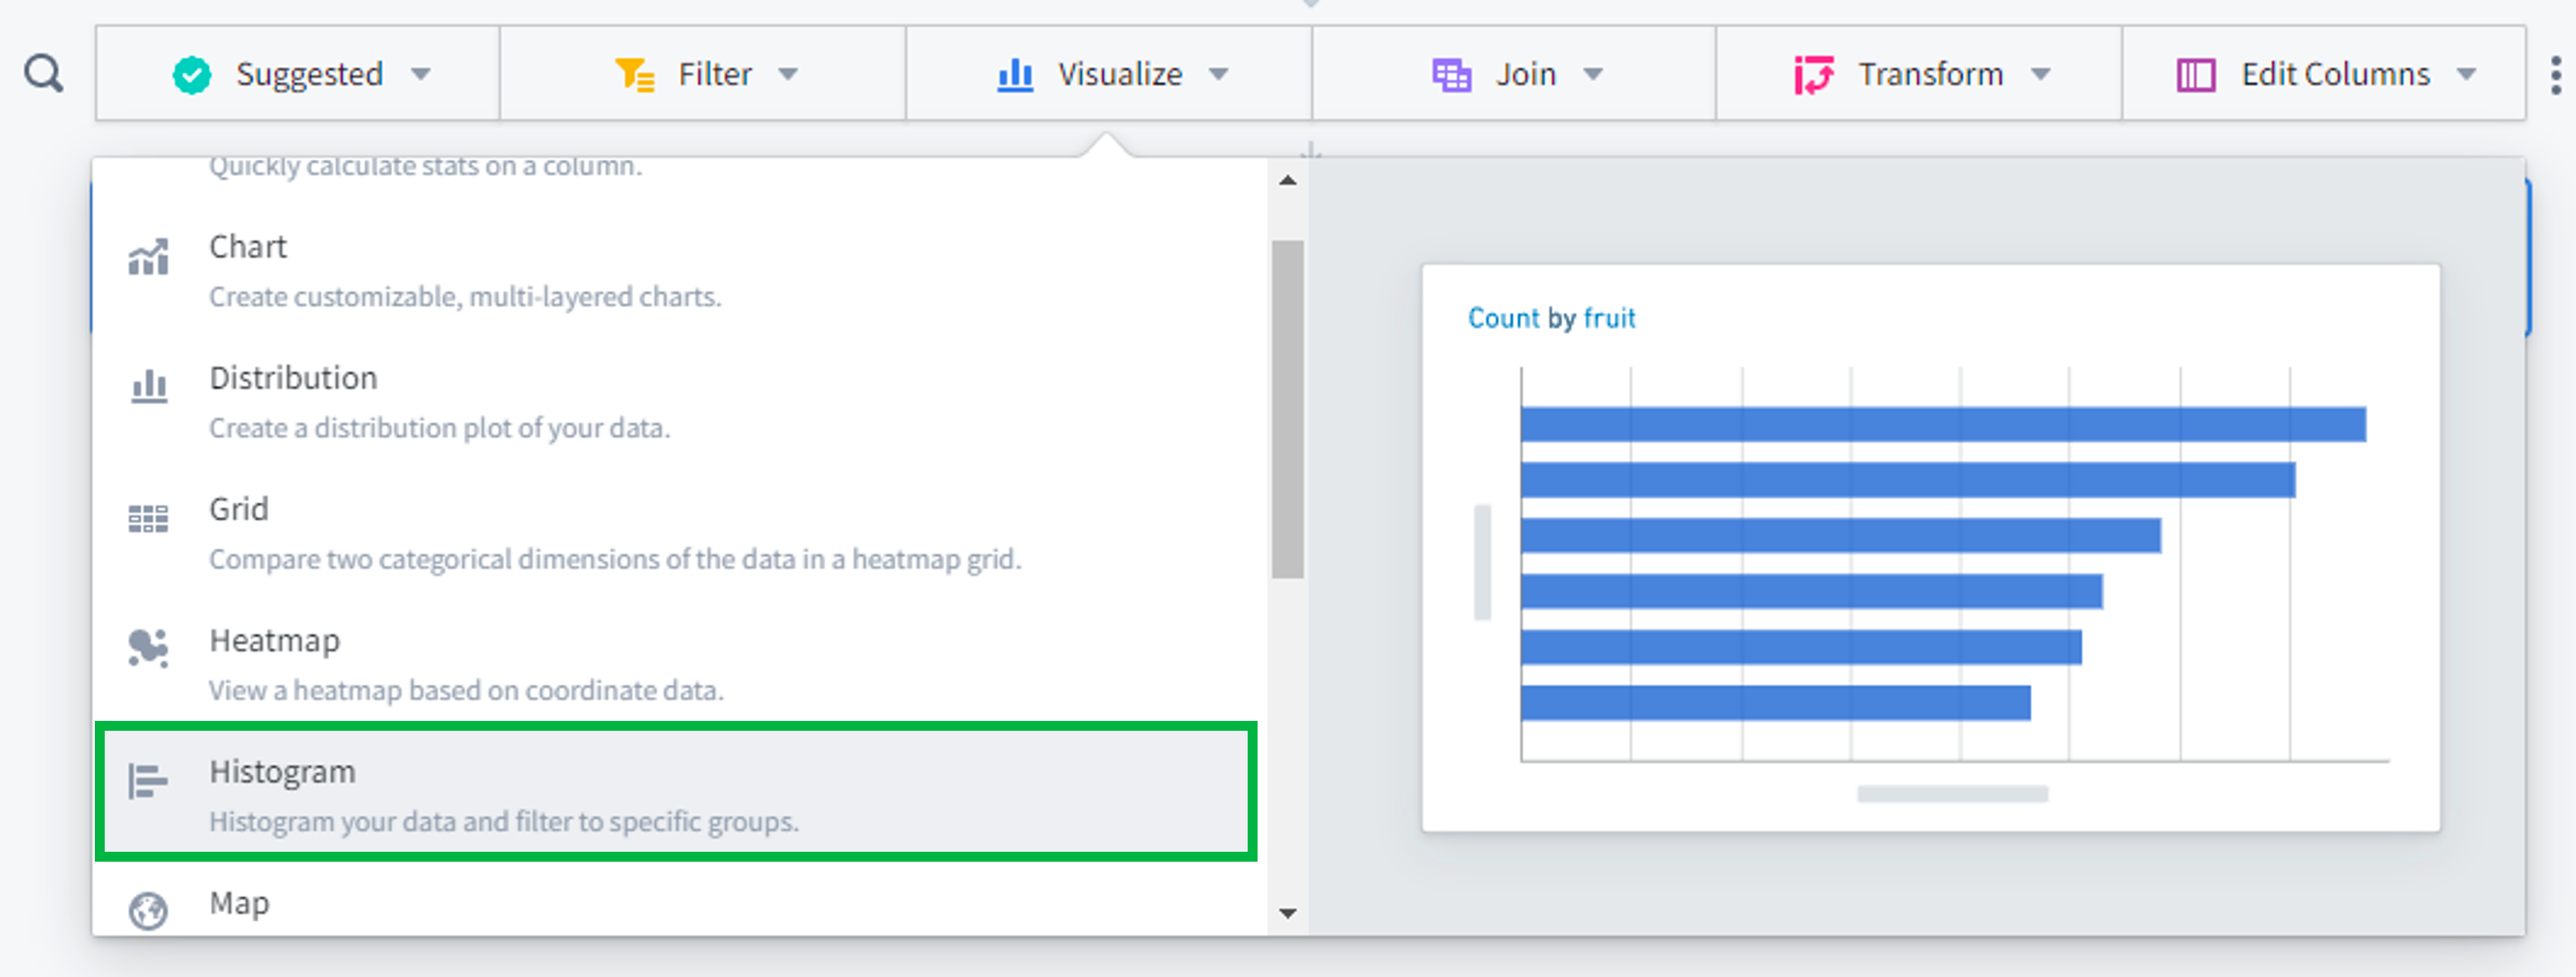
In the Board Toolbar, click on the Visualize category, then select the Histogram Board.