17 - Reviewing Tabular Geospatial Data
This content is also available at learn.palantir.com ↗ and is presented here for accessibility purposes.
When tabular data contains geospatial elements, analysts can use Contour to visualize it or Code Workbook to apply common libraries for various geospatial analysis workflows.
In this task, we'll review some of the ways geospatial data appears in tabular data.
🔨 Task Instructions
-
Open the
runwaysdataset located in/Foundry Training and Resources/Example Data/Aviation Ontology/runways. -
Scroll through the columns, noting that there are four that contain geospatial data:
latitude: the airport's latitude. Analysts can use this property (along with the accompanying longitude) to plot a point in a Contour map.longitude: the airport's longitude. Analysts can use this property (along with the accompanying latitude) to plot a point in a Contour map.geohash: Concatenation of latitude and longitude that is mapped to a geohash property in the Ontology so that it can be used to plot points in Ontology-aware applications.line_geojson: JSON representation of a shape, in this case of the runway line, that can be used in tabular and Ontology analysis applications.
-
Let's show how the lat/long values and the geoJSON in the tabular data can be represented in Contour. Click the blue Analyze button to open the dataset in Contour.
-
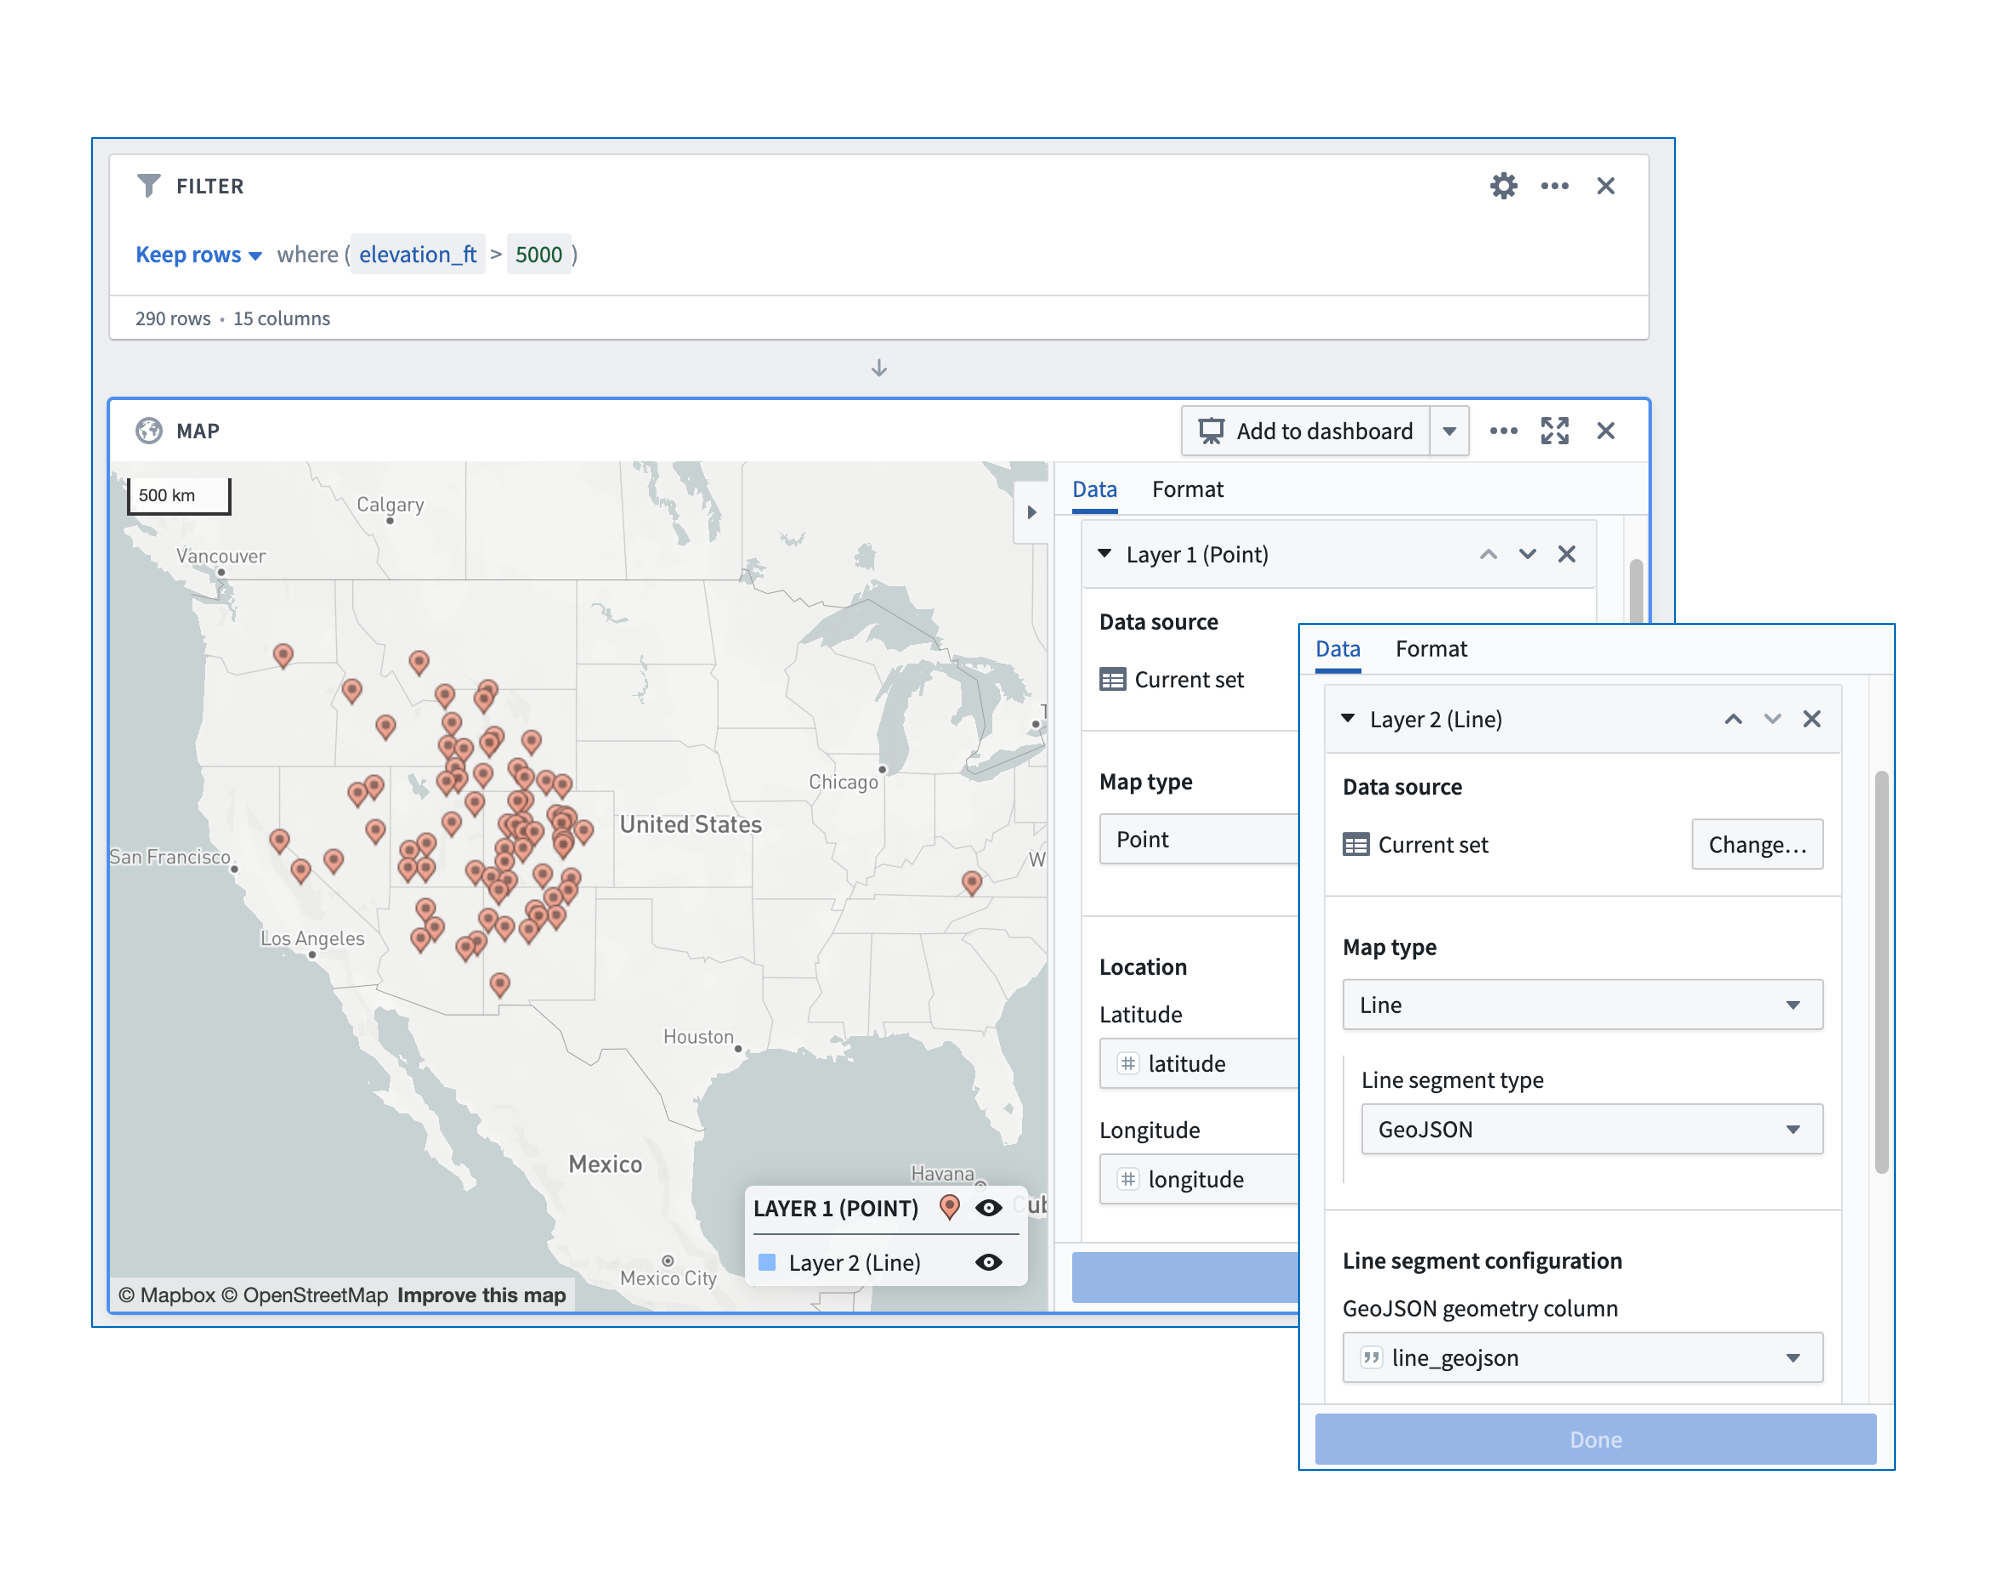
Filter to just those rows where the
elevation_ft> 5000. -
Add a Map board to your analysis.
-
Configure two layers in the board: one to represent the airport points (using the
latitudeandlongitudecolumns) and another to show the runway lines (using theline_geojsoncolumn) as shown below.
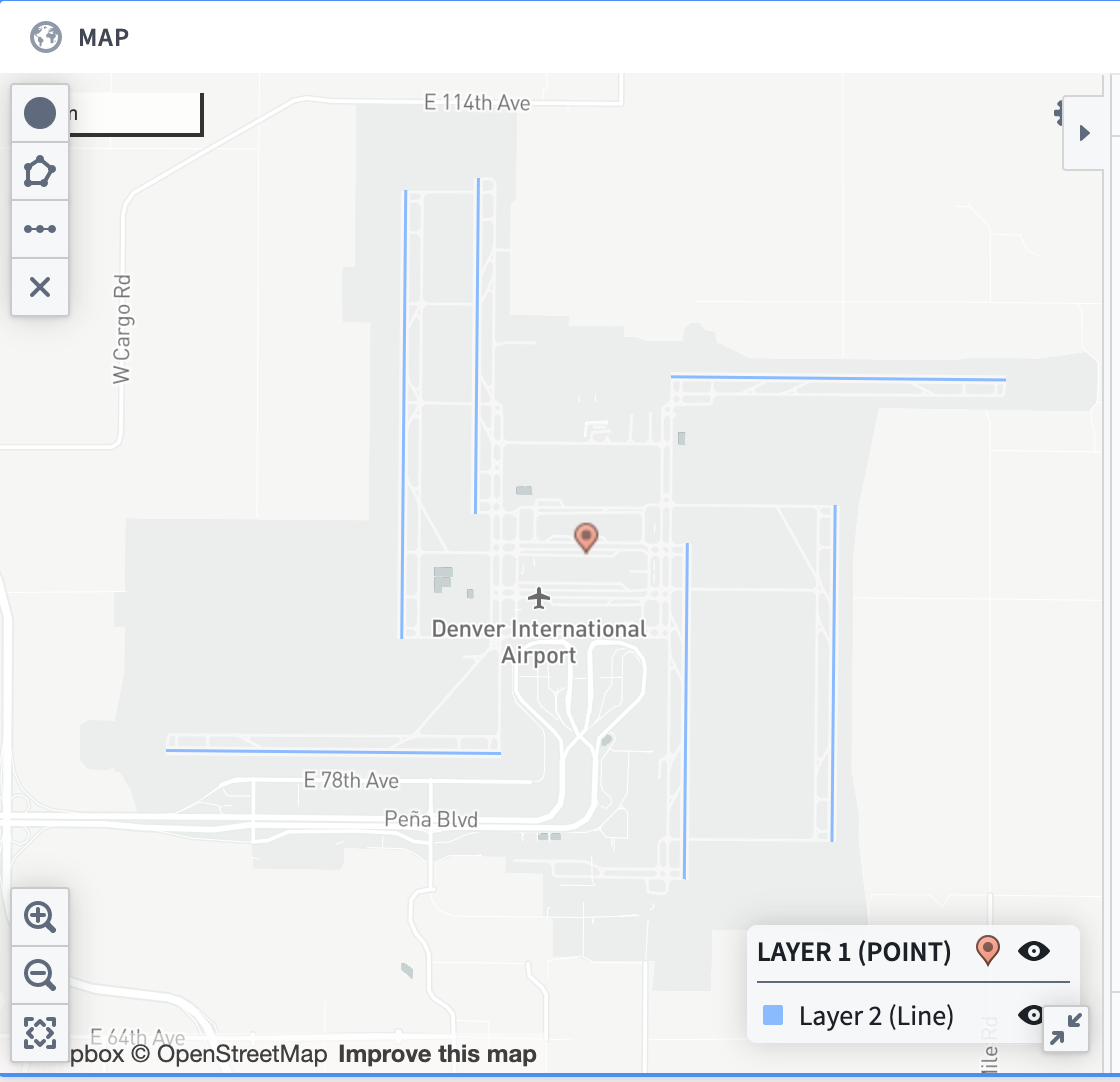
- Zoom in on any of the airport points to see the geojson runway lines.