Regression evaluator
One of the default evaluation libraries in a modeling objective is the Regression evaluator. This library provides a core set of metrics commonly used to evaluate regression models.

Included metrics
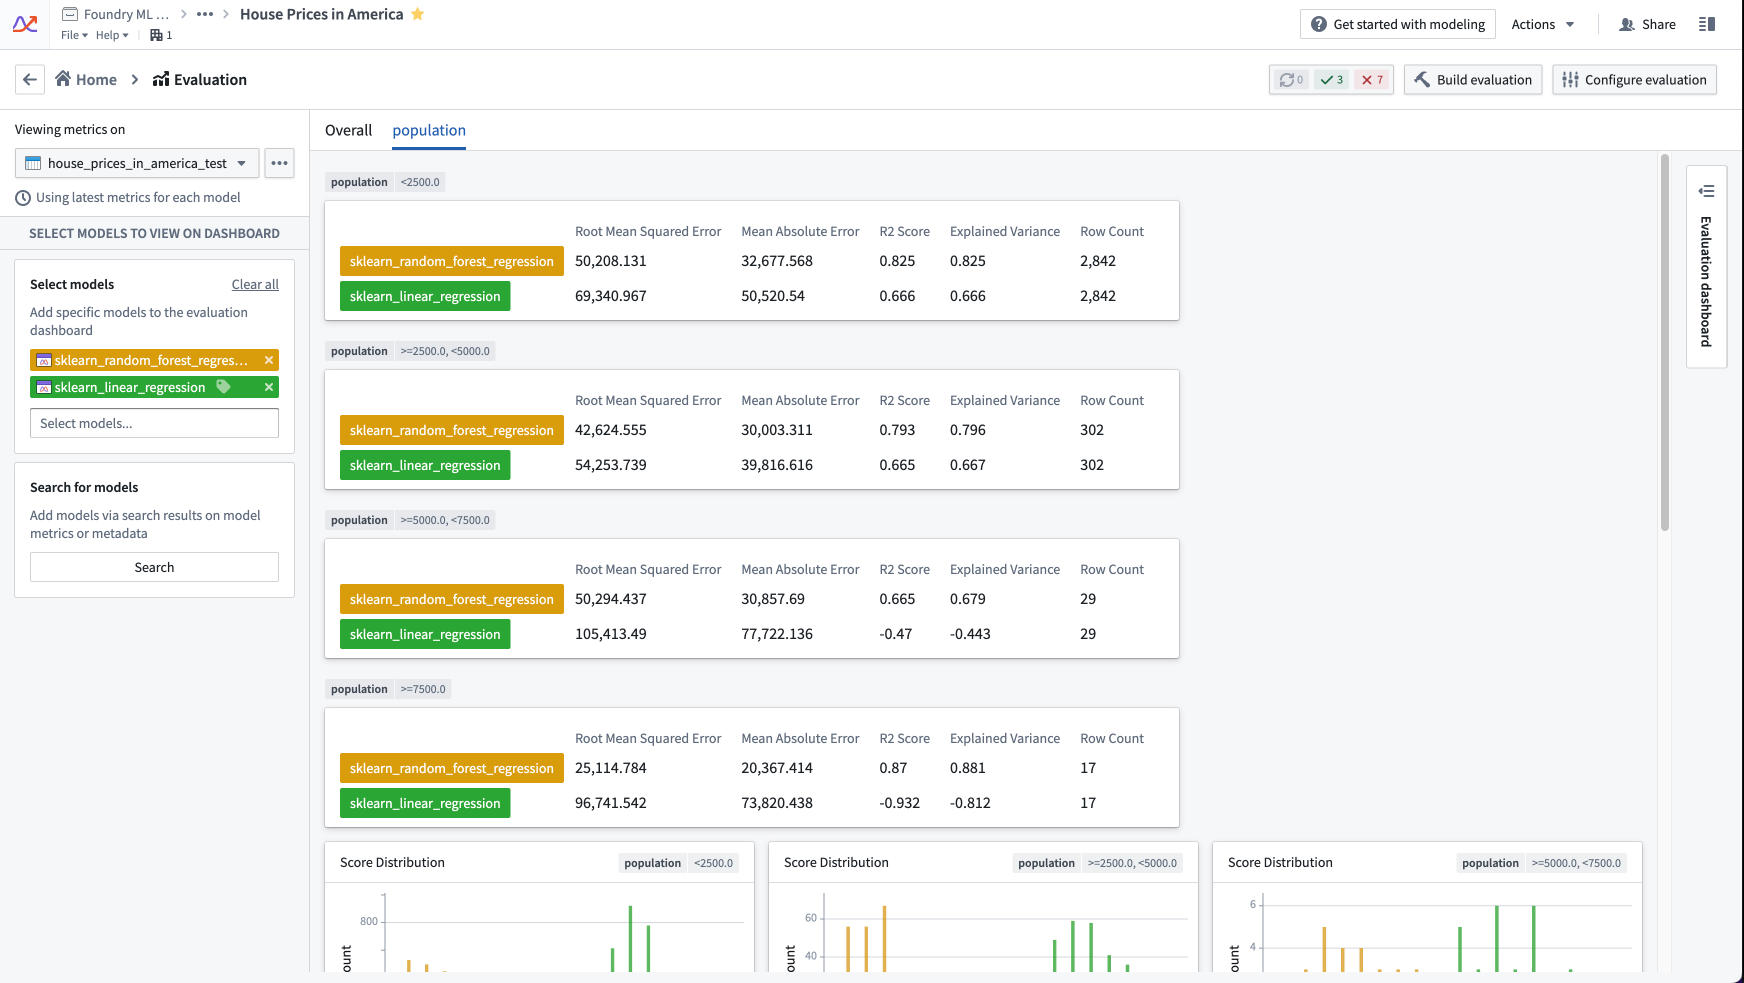
The below metrics are produced for every subset bucket configured in the evaluation dashboard.
The default regression evaluator produces the following numeric metrics:
- Row Count: The number of records in the evaluation dataset.
- Mean Absolute Error: The average error (difference) between the label data and the model prediction, regardless of the direction of error. The value is always positive and approaches 0 as a model performs better on the evaluation dataset.
- Root Mean Squared Error: Similar to mean absolute error, the root mean squared error also represents a difference between the label data and the model prediction, ignoring the direction of error. The root mean squared error, however, gives more weight to predictions that are further away from the label data. This value is always positive and approaches 0 as a model performs better on the evaluation dataset.
- R2 Score: The R2 (R squared) score represents the proportion of variance in the label data that is explained by the model. This value is always less than or equal to 1, and a score closer to 1 represents a model that performs better against the evaluation dataset. The R2 score can be negative.
- Explained Variance: Similar to the R2 score, this represents the proportion of variance in the label data that is explained by the model predictions. Explained variance differs from the R2 score when the average error is non-zero; this difference indicates model bias. This value is always less than or equal to 1, and a score closer to 1 represents a model that performs better against the evaluation dataset. The explained variance can be negative.
The default regression evaluator produces the following plots:
- Score distribution: Chart showing the distribution of model predictions on the evaluation dataset.
- Residuals: Chart showing the distribution of residuals on the evaluation dataset, where a residual is the
label_value - prediction.
Configuration
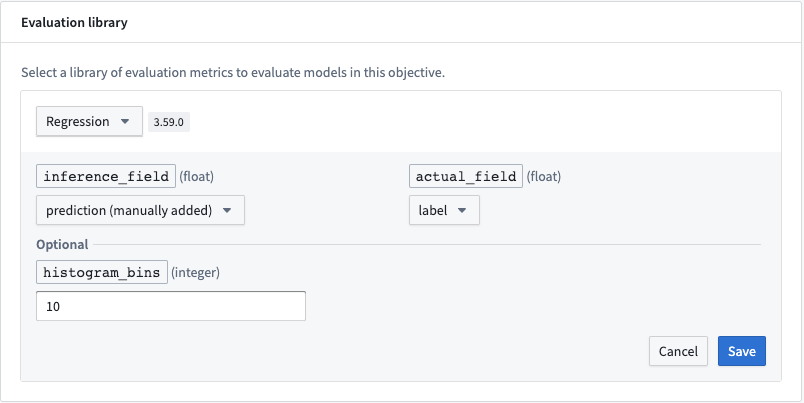
For full configuration instructions, see the documentation on how to configure a model evaluation library.
Required fields
The following fields are required for a regression evaluator. The expected value type for these columns is integer.
- inference_field: Column that represents the prediction of the model.
- actual_field: Column containing values to which a model's predictions should be compared.
Optional fields
- histogram_bins: The number of buckets into which to group the residuals and model scores for the plots of score distribution and residuals. If not provided, this will default to
10.
