Binary classification evaluator
One of the default evaluation libraries in a modeling objective is the binary classification evaluator. This library provides a core set of commonly used metrics for evaluating binary classification models.

Included metrics
The below metrics are produced for every subset bucket configured in the evaluation dashboard. It may not be possible to generate all metrics on every subset if, for example, the generated subset does not contain both classes in the model prediction or label columns.
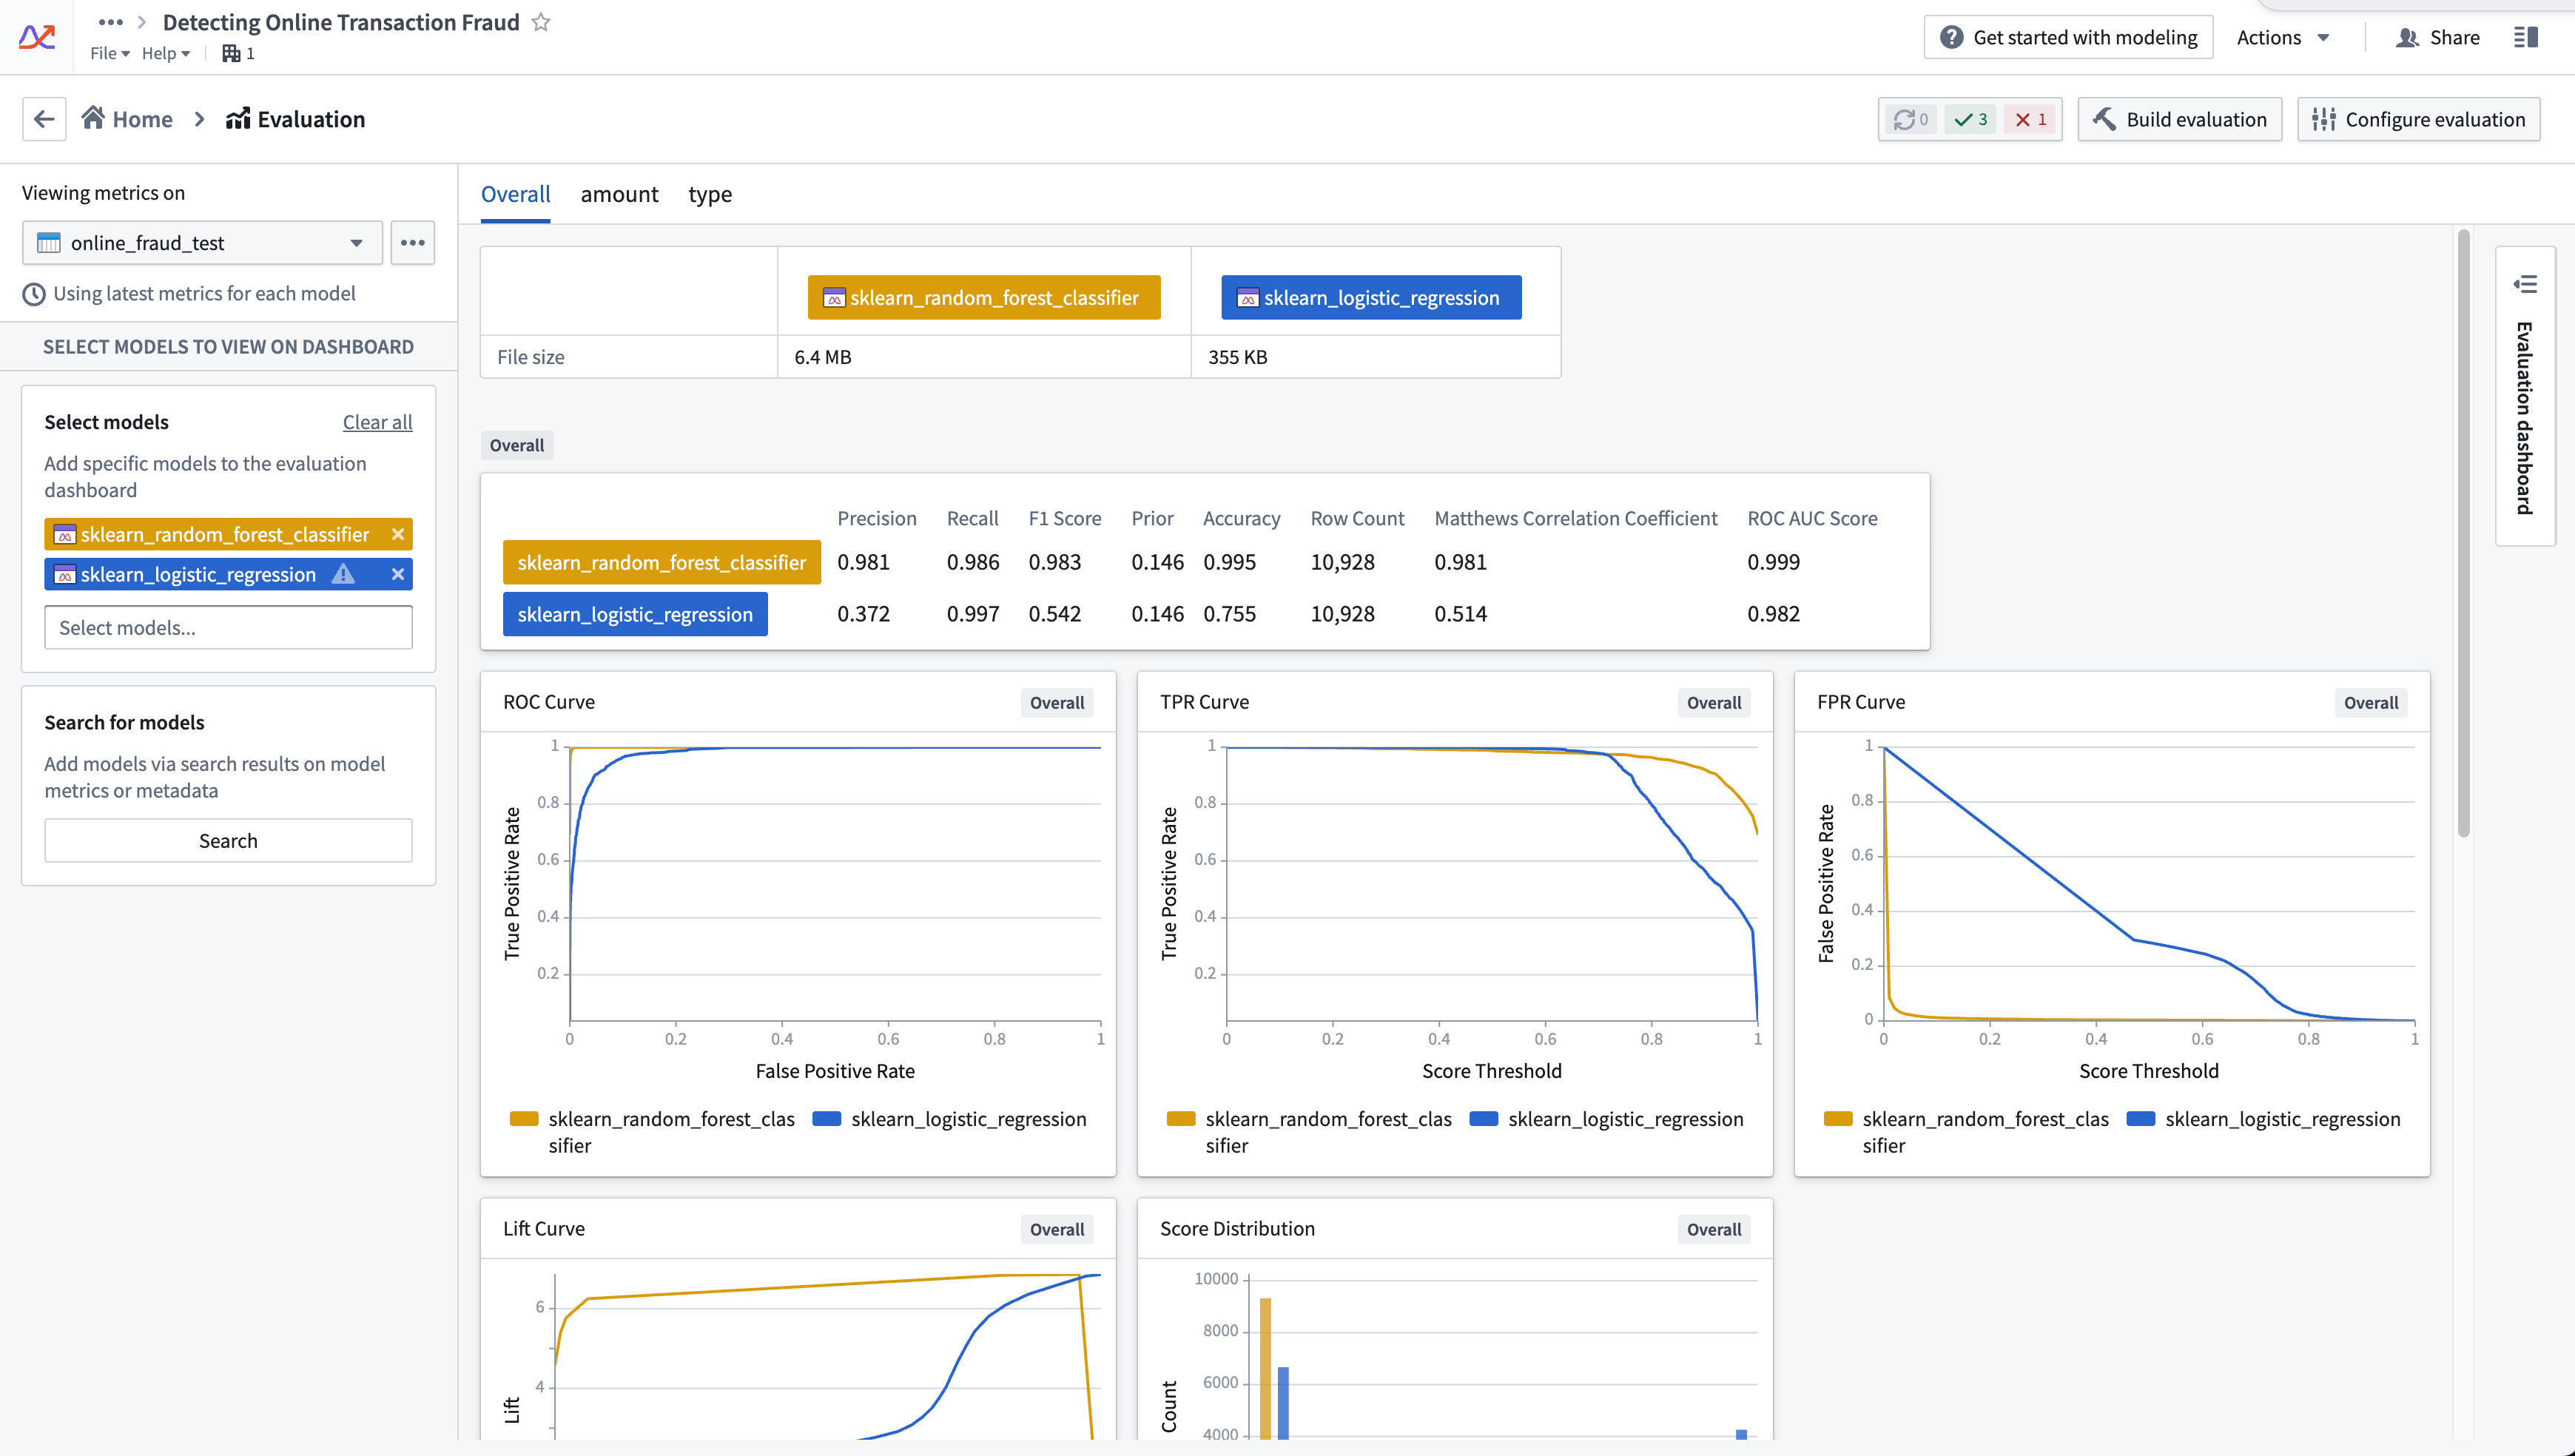
The default binary classification evaluator produces the following numeric metrics:
- Row count: The number of records in the evaluation dataset.
- Prior: The proportion of positive results in the evaluation dataset. Note that the prior is not a direct measure of model performance but can be useful to contextualize other metrics.
- Accuracy: The proportion of records that were correctly categorized. A model's accuracy ranges between 0 and 1, where an accuracy of 1 represents a model that is correctly categorizing every record in the evaluation dataset.
- Precision: The number of true positives divided by the sum of the true positives and false positives. This will range between 0 and 1, where 1 is perfect model precision.
- Recall: The total number of true positives divided by the sum of the true positives and false negatives. This will range between 0 and 1, where 1 is perfect model recall. Also known as sensitivity.
- F1 score: The harmonic mean of the precision and recall, calculated as the product of precision and recall divided by the sum of precision and recall. A model's F1 score ranges between 0 and 1, where 1 represents a model that is correctly categorizing every record in the evaluation dataset.
- Matthews correlation coefficient (MCC): A numerical measure of model performance that combines the numeric correlation between the label and prediction values for each of the two classification classes equally. As a result, the MCC will only be high when the classifier is performing well on both classes. The MCC will range between -1 and 1, where a score of 1 is correctly categorizing every record.
- ROC AUC score (requires probability): The area under the ROC (receiver operating characteristic) curve; AUC stands for "Area Under Curve". Ranges from 0 to 1, where a score of 1 represents a perfect model and a score of 0.5 is the expected score for a model that is randomly guessing.
The default binary classification evaluator produces the following plots:
- Confusion matrix: Displays the number of true positive, true negative, false positive, and false negatives for predictions in the evaluation dataset.
- Score distribution: A bar chart of model predictions on the evaluation dataset.
- Probability distribution (requires probability): A bar chart of the model output probabilities on the evaluation dataset. The bucket width is
0.05, which results in 20 total buckets in the[0.0, 1.0]range. - ROC curve (requires probability): Plots the True Positive Rate against the False Positive Rate for different probabilities. A steeper curve generally indicates better model performance.
- True positive rate (TPR) curve (requires probability): The TPR curve plots the true positive rate against a model's prediction probability.
- False positive rate (FPR) curve (requires probability): The FPR curve plots the false positive rate against a model's prediction probability.
- Lift curve (requires probability): Shows the model's lift at each probability; lift is a measure of models performance on the positive class versus random chance.
Configuration
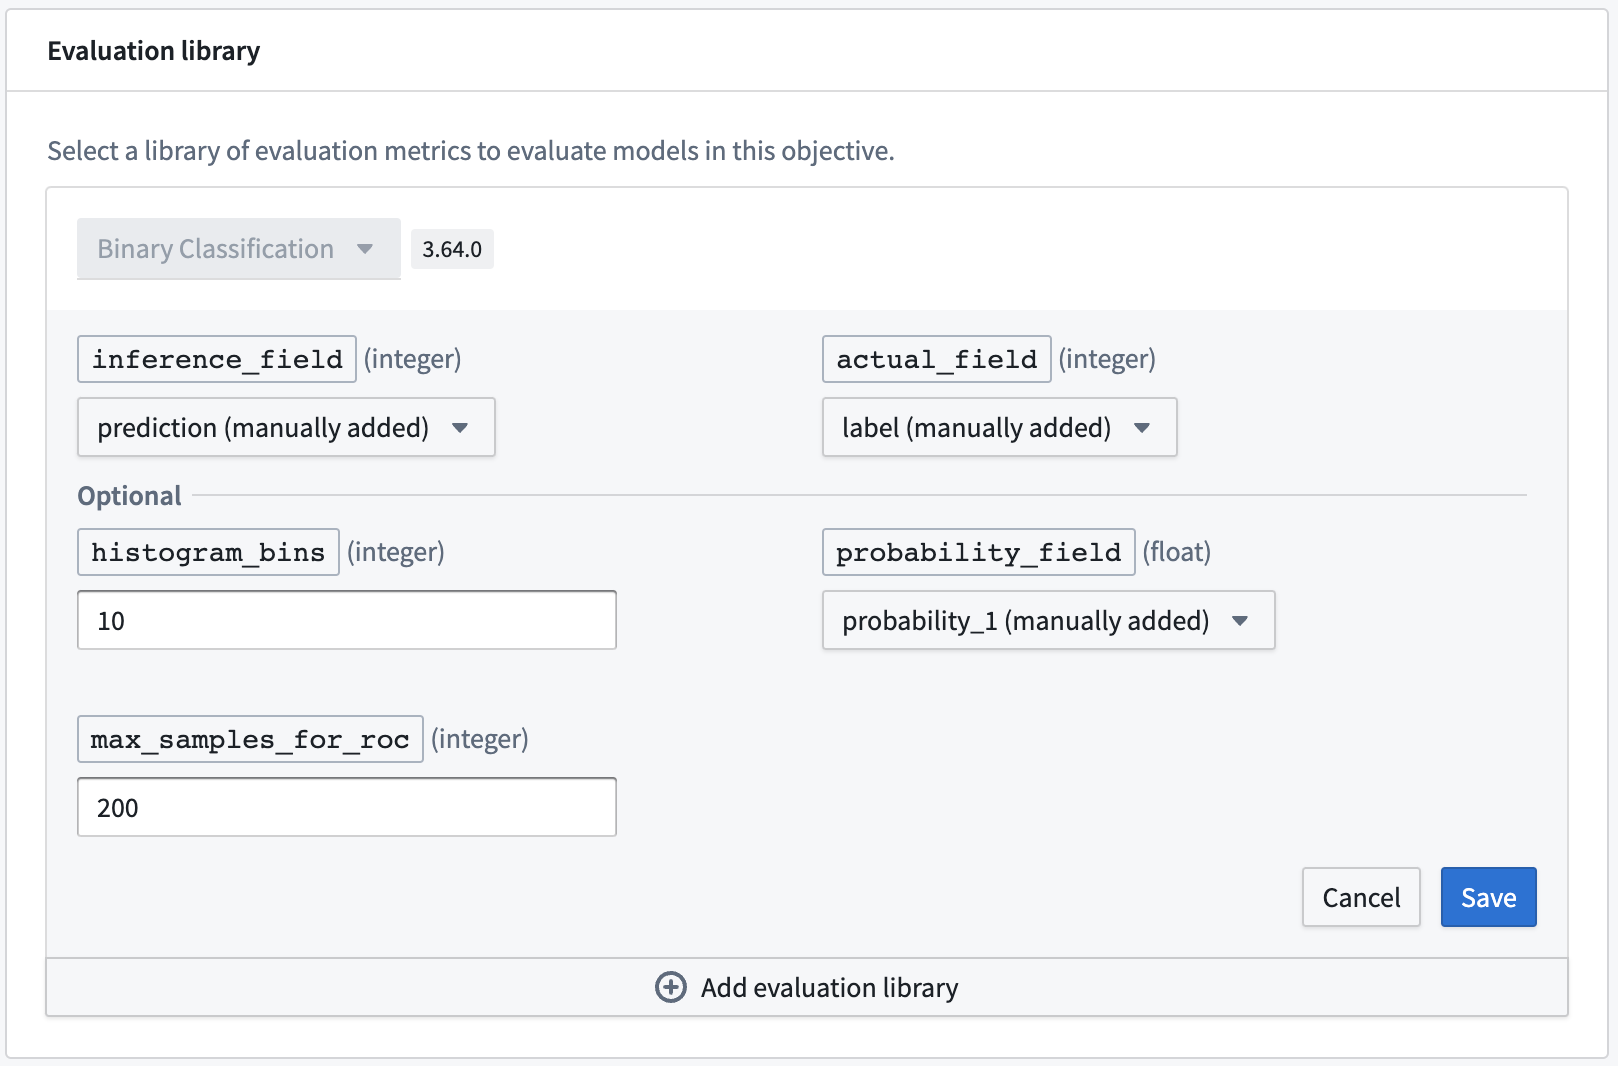
For full configuration instructions, see the documentation on how to configure a model evaluation library.
Required fields
The following fields are required for a binary classification evaluator. The expected value type for these columns is integer.
- inference_field: Column that represents the prediction classification of the model. This evaluator assumes that a
1is the positive class and a0is the negative class. - actual_field: Column containing values to which a model's predictions should be compared. This evaluator assumes that a
1is the positive class and a0is the negative class.
Optional fields
-
probability_field: This is an optional field that represents the probability of a positive prediction class. When the probability_field is provided, the default binary classification evaluation library will produce the following metrics:
- ROC AUC score
- ROC curve
- TPR curve
- FPR curve
- Lift curve
-
max_samples_for_roc The maximum number of samples to generate the model ROC curve on. If not provided, this will default to
200.
