Code Workbooks 소개10 - 새 브랜치에서 변경 사항 만들기
10 - 새 브랜치에서 변경 사항 만들기
이 콘텐츠는 learn.palantir.com ↗에서도 사용할 수 있으며 접근성을 위해 여기에 제공됩니다.
📖 작업 소개
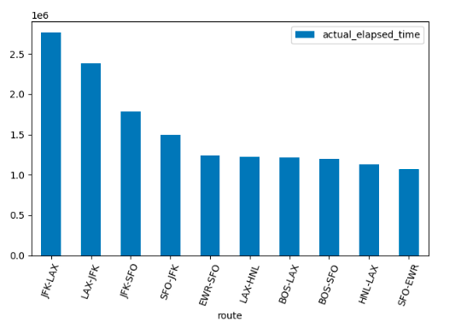
이제 워크북 상단에 Branch: test-branch가 표시되어야 합니다. time_by_carrier 시각화 노드를 클릭하면 화면 왼쪽 하단에 코드가 표시됩니다. 현재 시각화는 비행 시간이 가장 많은 10개 항공사의 비행 시간(시간)을 그래프로 표시하고 있습니다. 이제 시각화를 업데이트하여 비행 시간이 가장 많은 10개 노선에 대한 다른 항공 그룹의 비행 시간(분)을 그래프로 표시하겠습니다.
🔨 작업 지시사항
def time_by_carrier(us_freight_flights):
    # 'origin'과 'dest' 컬럼을 이용해 'route' 컬럼을 생성하고, 이를 pandas 데이터프레임으로 변환합니다.
    tf_pdf = us_freight_flights.withColumn('route', F.concat(F.col("origin"), F.lit("-"), F.col("dest"))).toPandas()
    # 'route'를 기준으로 그룹화하고 'actual_elapsed_time'의 합계를 계산합니다.
    tf_grouped = tf_pdf.groupby('route')['actual_elapsed_time'].sum().to_frame().reset_index()
    # 'actual_elapsed_time' 기준으로 내림차순 정렬하고 상위 10개 항목을 필터링합니다.
    tf_grouped = tf_grouped.sort_values(by=['actual_elapsed_time'], ascending=False).head(10)
    # 막대 그래프를 그립니다.
    tf_grouped.plot.bar(x='route', y='actual_elapsed_time')
    plt.tight_layout()
    plt.xticks(rotation=70)
    plt.show()
    # 원래의 데이터프레임을 반환합니다.
    return us_freight_flights
- 위의 블록으로
time_by_carrier코드 전체를 교체하십시오. - 업데이트된 변환을 실행하려면 미리보기를 클릭하십시오.
- 변환이 완료되면, 코드 에디터 아래의 시각화 탭을 클릭하여 업데이트된 그래프를 확인하십시오.
